Tool Search: Data Validation Report
Data Validation Tools are available as part of the Campus Data Suite, Campus State Edition, and districts connected to a State Edition.
The Data Validation Report allows users to generate a report containing data based on Validation Groups established via the Validation Groups tool. District users can run the report against their local data set or the state's data set.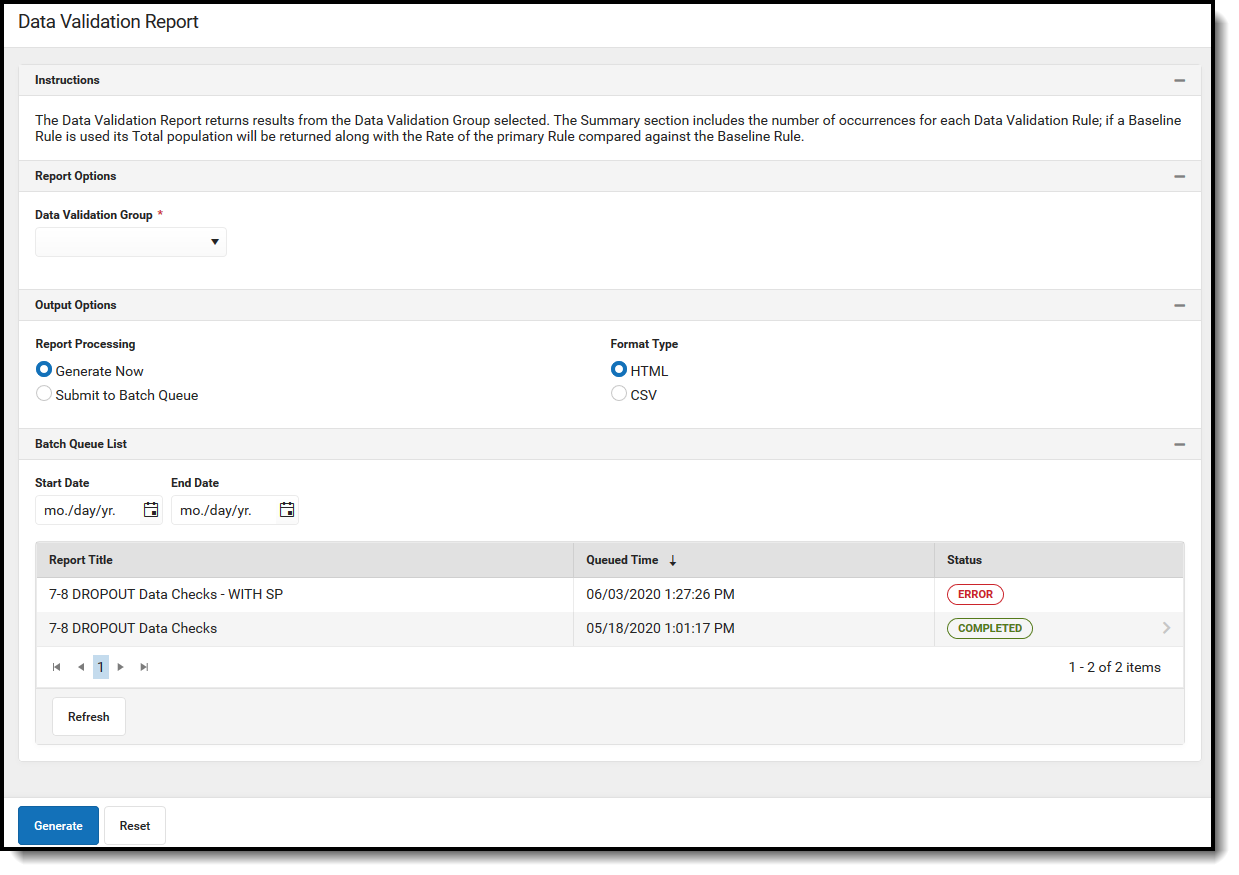
Prerequisites
Create rules within the Validation Rules tool.
Rules only need to be created if users want to report data on user-defined criteria. Validation Groups can be made using Campus-supplied rules which are populated automatically within the Validation Groups tool.
- Setup groups within the Validation Groups tool.
See the Data Validation Tool Rights article to learn about the rights needed to use this and other Data Validation tools.
Generating the Data Validation Report
The Data Validation Report can be generated using previously established Validation Groups.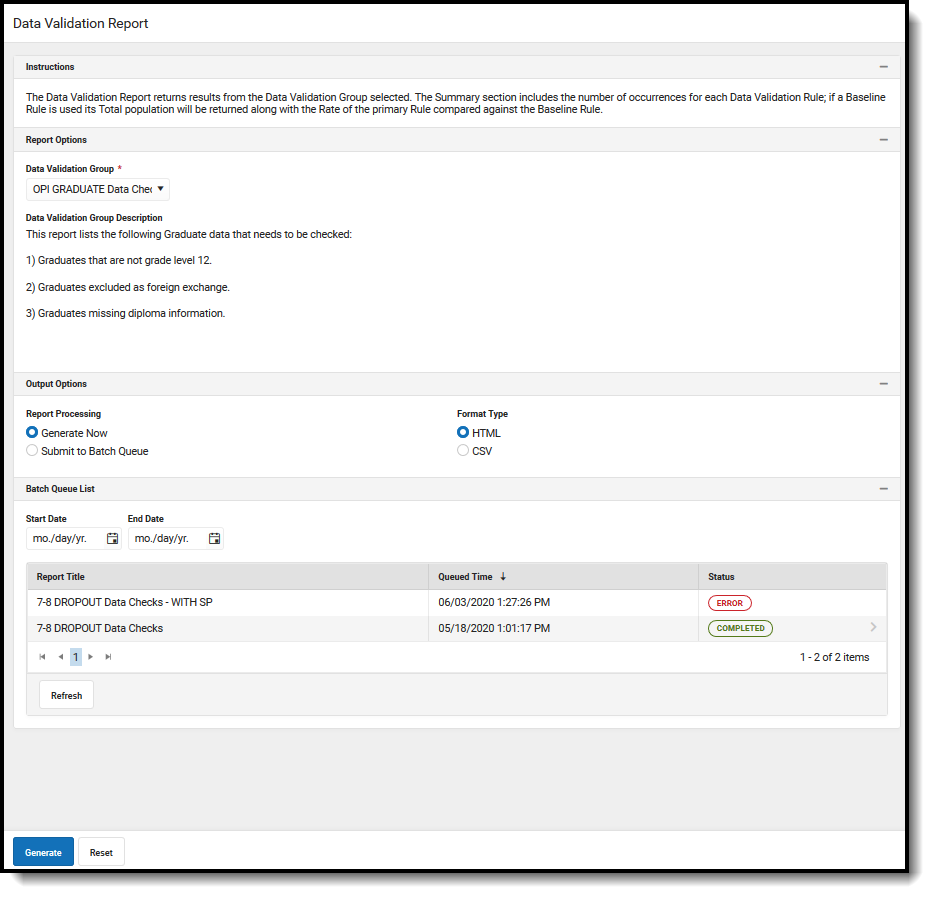
Data Validation Report Editor
| Field | Description | |
|---|---|---|
| Data Validation Group | Allows the user to select the Data Validation Group that will be used for the report. | |
| Data Validation GroupDescription | The description of the Data Validation Group being used for the report. | |
| Report Data Source For State-Linked District Editions Only. | If a Data Validation Group is State-owned, the report may be generated against the State Edition's database. If 'State Dataset' is chosen, then Report Processing is locked to Batch Queue.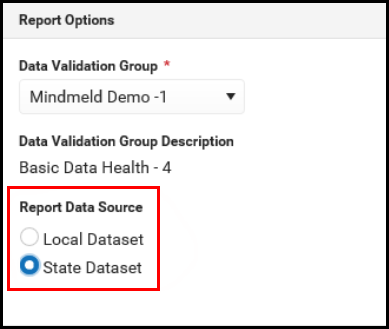 | |
| Output Options | Generate Now | Generates the report immediately after selecting the Generate button. |
| Submit to Batch Queue | Submits the report to that Batch Queue to generate at later time. Users are able to select a date and time for the report to generate. For more information regarding Batch Queue, refer to the Batch Queue article. | |
| Format Options | Allows the user to select whether the report will generate in HTML or CSV format. | |
| Batch Queue List | Displays a list of reports that have been submitted to the Batch Queue. | |
| Start Date | The date range for the list of reports displayed in the Batch Queue List. | |
| End Date | ||
| Report Title | Title of the submitted report. | |
| Queued Time | Time the report was generated. | |
| Status | Status of the report. When the report is completed, users can click on the 'Completed' link to view the report. | |
| Refresh | Refreshes the list of reports in the Queue list. | |
| Generate | Generates the report. | |
| Reset | Clears the fields in the Data Validation Report editor. | |
To generate the Data Validation Report:
- Select a Data Validation Group. A description of the group displays below the name of the group.
- Select an Output Option, either Generate Now or Submit to Batch Queue.
- Select a Format for the report, either HTML or CSV.
- Select the Generate button. The Report will appear in a separate window in the designated format.
Understanding the Data Validation Report
Understanding the Data Validation Report means understanding what data is being reported per rule within the Validation Group.
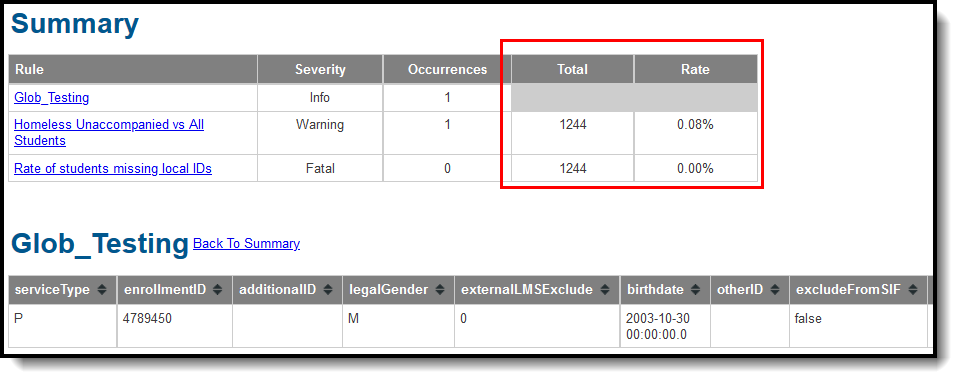
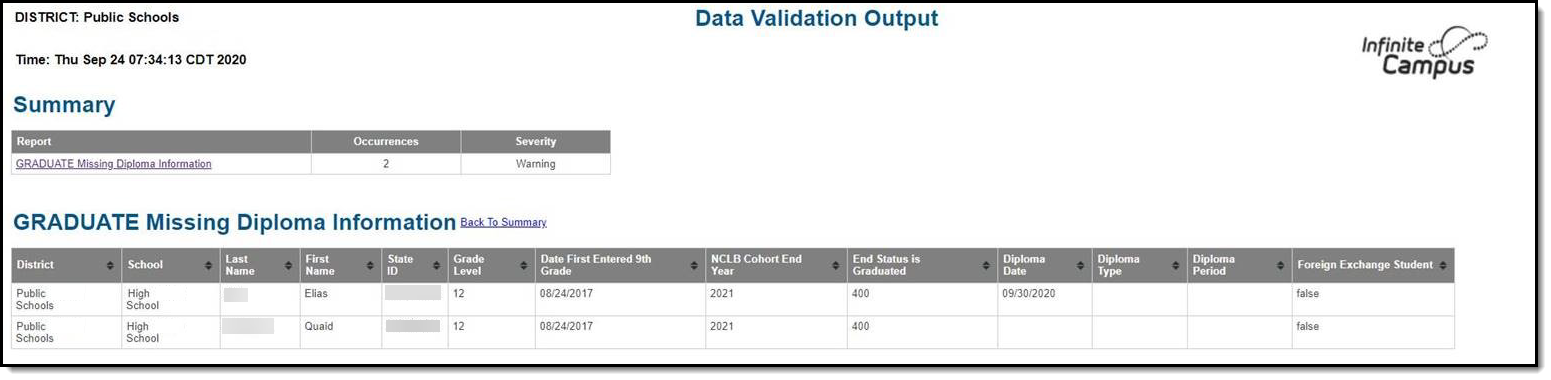
The Summary section lists all rules within the report, the number of students (occurrences) and the severity of each report. Rules included in the report are based on rules within the Validation Group being reported.
To quickly access rule information, select the name of the rule within the Rule column. You will be automatically sent to the area within the report where rule data exists.
The columns and information reported for each report is based on how each rule is defined within the Validation Rules tool.
If a Baseline Rule is used, the total population is returned along with the rate of the Primary Rule compared against the Baseline Rule.