Tool Search: Grade Book
The scoring analysis options available in the Grade Book differ based on whether the task you're scoring uses Points/Marks or Rubrics.
You can score standards with any of the three options, but grading tasks can only be scored with Points or Marks.
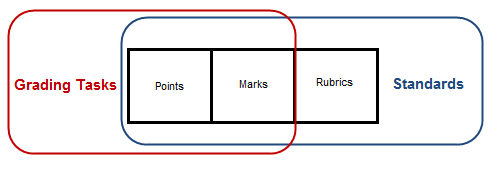
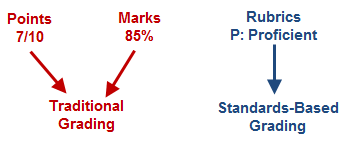
Points and Marks express student performance as a number, such as 7/10 points or 85%. Rubrics describe the quality of student performance, such as Developing or Proficient.
Points and Marks represent "traditional grading," whereas scoring with rubrics applies a "standards-based" approach.
Options Available for Traditional Grading
Grading Tasks are scored using Points or Marks, which means that grades are calculated based on the points or percentage earned by the student on each assignment and the subsequent weight of assignments and categories. Standards can be scored using Points or Marks as well.
All of the options described in this article are dependent on establishing Grade Calc Options to calculate In Progress Grades.
The following sections describe:
- Sparkline Graphs, which summarize individual student performance.
- Box and Whisker Diagrams, which display student performance in relation to other students in the section.
- The Calculation Summary that displays for an assignment or category.
- The Grade Totals section that includes In Progress calculations and posted grades.
Sparkline Graphs
If you've set the Sparkline Graph preference, a blue sparkline graph displays next to the student's name. This graph condenses all scores into a compact graph that shows the patterns in the student's overall performance over time. This graph is always displayed chronologically, regardless of assignment sort options.
Sparkline graphs calculate based on the percentage of a score, rather than by the numeric score value. Therefore, a 6 our of 10 and a 60 out of 100 would both calculate as 60%.
Hover over the sparkline graph to view a tool tip indicating the number of scores represented in the graph.

Sparkline Graph Example
In this example, Claire's performance steadily improves over four assignments. The line is created by connecting scores to show progress over time.
Box and Whisker Diagrams
Click on a student's name or use the key command ALT S to expand the student section and view the box and whisker diagram for each assignment, as well as the Categories and In Progress section of the Grade Totals. These diagrams display student performance in relation to other students in the section, rather than points possible.
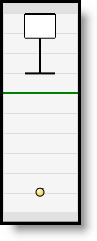
To build these diagrams, the Grade Book divides a class's scores on an assignment into quarters, called quartiles. The center line of the diagram represents the median score, with half of the students scores falling above and half below. The middle 50% of scores form the box, while the top and bottom 25% of scores form the whiskers. The current student's score is represented by a yellow dot. Since lines are based on averages rather than raw scores, student scores that are outliers, or far from the median score (average), can appear outside the diagram.
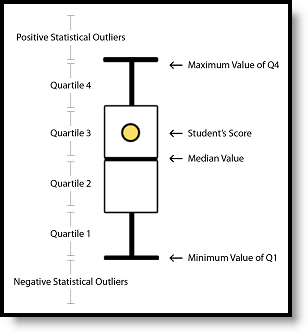
A Box and Whisker Diagram
In the Grade Book, a score scale appears along the left side indicating where scores fall by percentage. The green line represents a passing score. Statistical outliers, or scores far from the median that tend to skew calculations, are indicated with an x for other students.
Box and Whisker Examples
The following examples explain two specific Box and Whisker plots. In these examples, there are 12 students in the class, which is three students per quartile. All assignments are out of 100 points.
Student is in the Fourth Quartile
In this example, the student is within the top quarter of the class.
The student scores that produced this diagram are as follows (example student's score in bold):
- Fourth Quartile (top quarter, upper whisker) - 100, 95, 90 (average: 95)
- Third Quartile (lower-top quarter, top half of box) - 80, 75, 70 (average: 75)
- Second Quartile (upper-bottom quarter, lower half of box) - 60, 55, 50 (average: 55)
- First Quartile (bottom quarter, lower whisker) - 40, 35, 30 (average: 45)
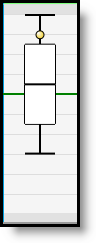
Student is a Low Outlier
In this example, the student received a score that is significantly lower than the rest of the class, called an outlier.
The student scores that produced this diagram are as follows (example student's score in bold):
- Fourth Quartile (top quarter, upper whisker) - 100, 100, 100 (average: 100)
- Third Quartile (lower-top quarter, top half of box) - 100, 100, 100 (average: 100) Note: Identical first and second quartiles explain the non-existent top half of the diagram.
- Second Quartile (upper-bottom quarter, lower half of box) - 100, 98, 88 (average: 95.3)
- First Quartile (bottom quarter, lower whisker) - 88, 80, 10 (average: 59.3)
Calculation Summary
Hover over an assignment header to view the calculation summary tool tip, which provides basic calculations describing student performance across the assignment. These calculations include all students, regardless of any filters selected.
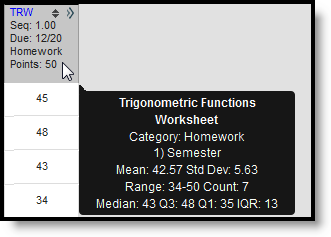
Calculation Summary for the Section in this Assignment
The calculations for an assignment scored with Assignment Marks or Points are determined as shown in the following table. Assignments that are not scored are not included in calculations.
Field | Description |
|---|---|
Mean | The average score. Calculated by adding all student scores together and dividing by the number of scores. |
Std Dev | Standard Deviation - the variation in scores based on the mean. A low standard deviation indicates that scores are grouped fairly close together, that students scored similarly on the assignment. A high standard deviation indicates that scores vary more greatly, that students did not score similarly on the assignment. |
Range | The range of the lowest score to the highest score. Displays as the lowest score - highest score (total scores). |
Count | The total number of scores entered for the assignment. |
Median | The middle score, half way between the highest and lowest scores. |
Q3 | The top score of Quartile 3, the 75th percentile. Halfway between the highest score and the median. |
Q1 | The top score of Quartile 1, the 25th percentile. Halfway between the lowest score and the median. |
IQR | Interquartile Range - the difference between Q1 and Q3. Like standard deviation, this value indicates the degree of variance across student scores. |
Points and Marks-Based Grade Totals
The Grade Totals include three sections, Posted Grades, In Progress Grades and Categories. In Progress values calculate automatically based on scores entered and cannot be directly modified. Posted grades appear on the student's Grades tab. Grades in the Posted column can be modified as desired by the teacher when the grading window is open; updated grades post upon save.
In Progress grades are only available if the Grade Calc Options are established. There, you have the option of indicating if the entered Weight for Categories should be honored and if the In Progress grade should calculate based on the raw score entered or the percent earned. Grades can only be posted if the grading window is open for the Grading Task.
Use ALT L to expand and collapse this area.
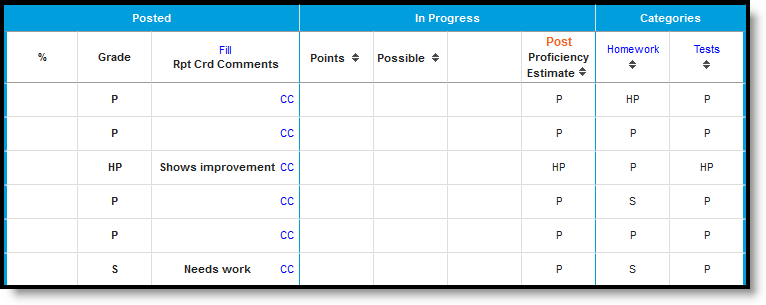
Grade Totals when using Mode of 3
In Progress grades are available for students to view on the Portal. Posting Grades is the action of publishing grades to the transcript.
Categories
A column displays for each Category in the Term and Task selected. A percentage calculates for each student based on assignments aligned to each category.
Categories marked as Exclude still have a percentage calculated but are not included in the In Progress calculations. Excluded categories appear with an asterisk.
The percentage calculated for each Category is affected by the following settings:
- Whether a Multiplier is entered for a Scoring Alignment. This value will only affect the Category percentage if the Grade Calc Option to Use score's % value is not set.
- Whether the Grade Calc Option to Use score's % value is set. For example, two assignments are scored as 8/10 and 100/100. The point value calculated for these two assignments would be 108/110, or 98%. The percent value calculated would be 80% and 100%, or 90% for the Category.
In Progress Grades
The In Progress grade also calculates from student scores, based on the grading scale selected in the Grade Calc Options. The Grade Calculation Option to Calculate In Progress Grade must be selected for these columns to appear. This section also includes the aggregate points earned by the student and the total points possible across assignments.
The In Progress Percent calculated will be affected by the following settings:
- Whether a Multiplier is entered for a Scoring Alignment. This value will only affect the percentage if the Grade Calc Option to Use score's % value is not set.
- Whether the Grade Calc Option to Use score's % value is set. For example, two assignments are scored as 8/10 and 100/100. The point value calculated for these two assignments would be 108/110, or 98%. The percent value calculated would be 80% and 100%, or 90% for the two.
- Whether a Weight is entered for a Category AND whether the Category is marked to be Excluded from calculation.
Posted Grades
See the Posting Grades article for more information about posting grades.
