Tool Search: Student Health Screening Report
The Student Health Screening Report provides a breakdown of student health screening information for all students within a district.
 Student Health Screening Report
Selection Criteria
Students must meet the following criteria to report on the Student Health Screening Report:
- All enrollments within the reporting school year are included as long as they do not have an end date before the Effective Date entered on the report editor or their enrollment end date is on or after the final term end date.
- Calendars marked as State Exclude, grades marked Exclude from State Reporting and students marked State exclude are not included in the report.
Generate the Report
- Enter the Effective Date. If this date does not fall within an active school calendar date, the most recent school year is used.
- Select Generate Report. The report will appear in a separate window in PDF format.
Understand the Student Health Screening Report
See the sections below for more information about each area of the Student Health Screening Report:
- Dental Screening Information
- Physical Exam Information
- Scoliosis Screening Information
- Vision Exam Information
- Vision Screening
- Hearing Screening
Dental Screening Information
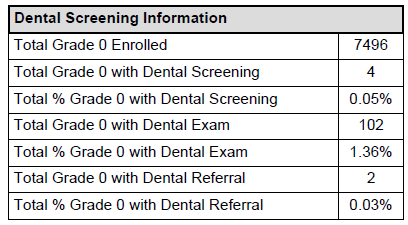 Image 2: Dental Screening Information
Element Name | Description | Campus Location |
|---|---|---|
Total Grade 0 Enrolled | The total number of students in the district enrolled in state grade level 0. | Scheduling & Courses > Calendar Setup > Grade Level Setup > State Grade Level |
| Total Grade 0 with Dental Screening | The total number of students in the district enrolled in state grade level 0 who have a dental screening with a Type = S: Dental Screening and the screening was within the start year of the reporting calendar (e.g., for the 2013-14 school year, the screening must be between January 1st 2013 through December 31st 2013). | Student Information > Health > Screening > Dental > Type, Date |
| Total % Grade 0 with Dental Screening | The total number of students in the district enrolled in state grade level 0 who have a dental screening with a Type = S: Dental Screening and the screening was within the start year of the reporting calendar divided by the total number of students in the district enrolled in state grade level 0 multiplied by 100. | Calculated |
| Total Grade 0 with Dental Exam | The total number of students in the district enrolled in state grade level 0 who have a dental screening with a Type = E: Dental Exam with a date within the start year of the reporting calendar. | Student Information > Health > Screening > Dental > Type, Date |
| Total % Grade 0 with Dental Exam | The total number of students in the district enrolled in state grade level 0 who have a dental screening with a Type = E: Dental Exam with a date within the start year of the reporting calendar divided by the total number of students in the district enrolled in state grade level 0 multiplied by 100. | Calculated |
| Total Grade 0 with Dental Referral | The total number of students in the district enrolled in state grade level 0 who have a dental screening with a Type = E: Dental Exam or S: Dental Screening with Referral Date that is not null and a date that is within the start year of the reporting calendar. | Student Information > Health > Screening > Dental > Type, Date, Referral Date |
| Total % Grade 0 with Dental Referral | The total number of students in the district enrolled in state grade level 0 who have a dental screening with a Type = E: Dental Exam or S: Dental Screening with Referral Date that is not null and a date that is within the start year of the reporting calendar divided by the total number of students in the district enrolled in state grade level 0 multiplied by 100. | Calculated |
Physical Exam Information
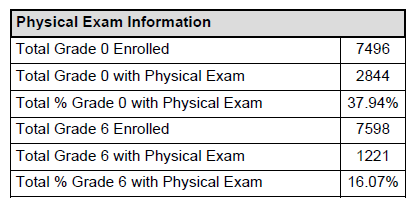 Image 3: Physical Exam Information
Element Name | Description | Campus Location |
|---|---|---|
Total Grade 0 Enrolled | The total number of students in the district enrolled in state grade level 0. | Scheduling & Courses > Calendar Setup > Grade Level Setup > State Grade Level |
| Total Grade 0 with Physical Exam | The total number of students in district enrolled in state grade level 0 with a screening detail date entered and a Type = Child and Teen Checkup or Early Childhood. The screening date must be on or before October 15th of the start year of the reporting calendar. | Student Information > Health > Screenings > Screening History |
| Total % Grade 0 with Physical Exam | The total number of students in district enrolled in state grade level 0 with a screening detail date entered and a Type = Child and Teen Checkup or Early Childhood divided by the total number of students in the district enrolled in state grade level 0 multiplied by 100. | Calculated |
| Total Grade 6 Enrolled | The total number of students in the district enrolled in state grade level 6. | Scheduling & Courses > Calendar Setup > Grade Level Setup > State Grade Level |
| Total Grade 6 with Physical Exam | The total number of students in district enrolled in state grade level 6 with a screening detail date entered and a Type = Child and Teen Checkup or Early Childhood. The screening date can be up to one year prior to the first term start date of the current calendar. | Student Information > Health > Screenings > Screening History |
| Total % Grade 6 with Physical Exam | The total number of students in district enrolled in state grade level 6 with a screening detail date entered and a Type = Child and Teen Checkup or Early Childhood divided by the total number of students in the district enrolled in state grade level 6 multiplied by 100. | Calculated |
Scoliosis Screening Information
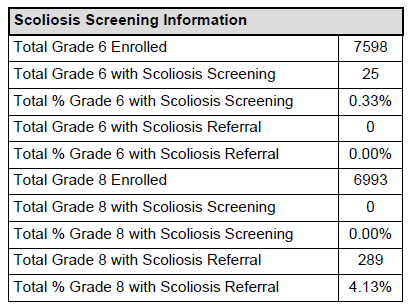 Image 4: Scoliosis Screening Information
Element Name | Description | Campus Location |
|---|---|---|
Total Grade 6 Enrolled | The total number of students in the district enrolled in state grade level 6. | Scheduling & Courses > Calendar Setup > Grade Level Setup > State Grade Level |
| Total Grade 6 with Scoliosis Screening | The total number of students in the district enrolled in state grade level 6 with a date entered in the scoliosis section of the screening tool with a Type = O: Original, OE: Outside Exam and Character = P: Passed or F: Failed. The date should be within 1 year of the first term's start date in the reporting calendar. | Student Information > Health > Screenings > Scoliosis > Date, Type, Character |
| Total % Grade 6 with Scoliosis Screening | The total number of students in the district enrolled in state grade level 6 with a date entered in the scoliosis section of the screening tool with a Type = O: Original, OE: Outside Exam and Character = P: Passed or F: Failed divided by the total number of students in the district enrolled in state grade level 6 multipled by 100. | Student Information > Health > Screenings > Scoliosis > Date, Type, Character |
| Total Grade 6 with Scoliosis Referral | The total number of students enrolled in grade 6 with a scoliosis screening Type = RE: Referral or O: Original and a referral date that is prior to the date the report is generated. | Student Information > Health > Screenings > Scoliosis > Date, Type, Character |
| Total % Grade 6 with Scoliosis Referral | The total number of students enrolled in grade 6 with a scoliosis screening Type = RE: Referral or O: Original and a referral date that is prior to the date the report is generated divided by the total number of students enrolled in state grade level 6 multiplied by 100. | Student Information > Health > Screenings > Scoliosis > Date, Type, Character |
| Total Grade 8 Enrolled | The total number of students in the district enrolled in state grade level 8. | Scheduling & Courses > Calendar Setup > Grade Level Setup > State Grade Level |
| Total Grade 8 with Scoliosis Screening | The total number of students in the district enrolled in state grade level 8 with a date entered in the scoliosis section of the screening tool with a Type = O: Original, OE: Outside Exam and Character = P: Passed or F: Failed. The date should be within 1 year of the first term's start date in the reporting calendar. | Student Information > Health > Screenings > Scoliosis > Date, Type, Character |
| Total % Grade 8 with Scoliosis Screening | The total number of students in the district enrolled in state grade level 8 with a date entered in the scoliosis section of the screening tool with a Type = O: Original, OE: Outside Exam and Character = P: Passed or F: Failed divided by the total number of students in the district enrolled in state grade level 6 multipled by 100. | Student Information > Health > Screenings > Scoliosis > Date, Type, Character |
| Total Grade 8 with Scoliosis Referral | The total number of students enrolled in grade 8 with a scoliosis screening Type = RE: Referral or O: Original and a referral date that is prior to the date the report is generated divided by the total number of students enroleld in state grade level 6 multiplied by 100. | Student Information > Health > Screenings > Scoliosis > Date, Type, Character |
| Total % Grade 8 with Scoliosis Referral | The total number of students enrolled in grade 8 with a scoliosis screening Type = RE: Referral or O: Original and a referral date that is prior to the date the report is generated divided by the total number of students enrolled in state grade level 6 multiplied by 100. | Student Information > Health > Screenings > Scoliosis > Date, Type, Character |
Vision Exam Information
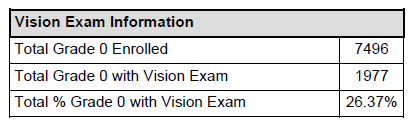 Image 5: Vision Exam Information
Element Name | Description | Campus Location |
|---|---|---|
Total Grade 0 Enrolled | The total number of students in the district enrolled in state grade level 0. | Scheduling & Courses > Calendar Setup > Grade Level Setup > State Grade Level |
| Total Grade 0 with Vision Exam | Total number of students in the district enrolled in state grade level 0 with a date listed under the vision section of the health screening with a Test Type = Vision Exam | Student Information > Health > Screenings > Vision > Date |
| Total % Grade 0 with Vision Exam | Total number of students in the district enrolled in state grade level 0 with a date listed under the vision section of the health screening with a Test Type = Vision Exam divided by the total number of students in the district enrolled in state grade level 0 multiplied by 100. | Calculated |
Vision Screening
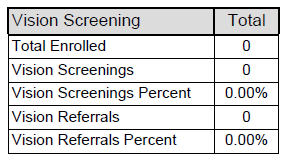 Image 6: Vision Screening
Element Name | Description | Campus Location |
|---|---|---|
Total Enrolled | The total number of students in the district enrolled. | Calculated |
| Vision Screenings | The number of students in the reporting calendar who have a vision screening date that is within the reporting school year with a Test Type = S: Vision Screening. | Student Information > Health > Screenings > Vision > Test Type, Date |
| Vision Screenings Percent | The number of students in the reporting calendar who have a vision screening date that is within the reporting school year with a Test Type = S: Vision Screening divided by the total students enrolled multiplied by 100. | Calculated |
| Vision Referrals | The number of students in the grade being reported who have a vision referral date within the start and end dates of the reporting school year with a Status = F: Failed. | Student Information > Health > Screenings > Vision > Status, Date |
| Vision Referrals Percent | The number of students in the grade being reported who have a vision referral date within the start and end dates of the reporting school year with a Status = F: Failed divided by the total number of students enrolled for the reporting grade multiplied by 100. | Calculated |
Hearing Screening
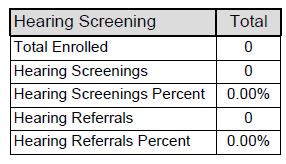 Image 7: Hearing Screening
Element Name | Description | Campus Location |
|---|---|---|
Total Enrolled | The total number of students in the district enrolled. | Calculated |
| Hearing Screenings | The number of students in the grade being reported who have a hearing screening date within the reporting calendar with a Type = O: Original. | Student Information > Health > Screenings > Hearing > Type, Date |
| Health Screenings Percent | The number of students in the grade being reported who have a hearing screening date within the reporting calendar with a Type = O: Original divided by the total number of student enrolled in the reporting grade multiplied by 100. | Calculated |
| Hearing Referrals | The number of students in the grade being reported who have a hearing screening date within the reporting calendar, a Type = R: Referral and a Status = F: Failed. | Student Information > Health > Screenings > Hearing > Type, Date, Status |
| Hearing Referrals Percent | The number of students in the grade being reported who have a hearing screening date within the reporting calendar, a Type = R: Referral and a Status = F: Failed divided by the total number of student enrolled in the reporting grade multiplied by 100. | Calculated |
