Tool Search: Grade Analysis Report
The Grade Analysis Report groups transcript scores by credit and course, then translates them into percentiles so users can easily understand the distribution of student performance for each credit/course. This report helps visualize aggregated performance by credit, making it easier to identify credits that students struggle to complete.
- This report is available only to users in districts that have purchased the Campus Analytics Suite.
- For more information about filtering dimensions and formatting, see the Pivot Designer article.
 Screenshot of the Grade Analysis Report
Read - View and generate the Grade Analysis Report
Write - N/A
Add - N/A
Delete - N/A
For more information about Tool Rights and how they function, see the Tool Rights article.
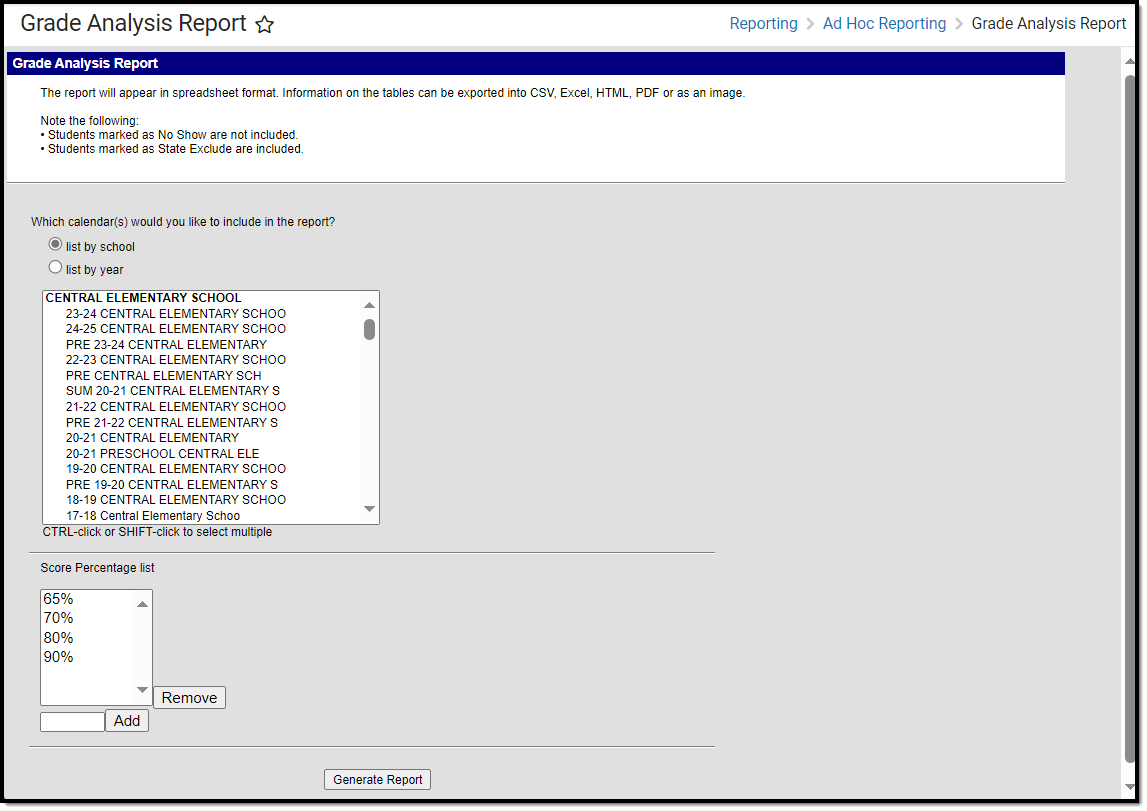
Generate the report
Use these steps to create a Grade Analysis Report:
- Select the calendar(s) to include.
- Configure Score Percentages:
- To remove a percentage, select it and click Remove.
- To add a percentage, enter a value and click Add.
- Click Generate Report.
- The report opens in a new window.
Understand the report
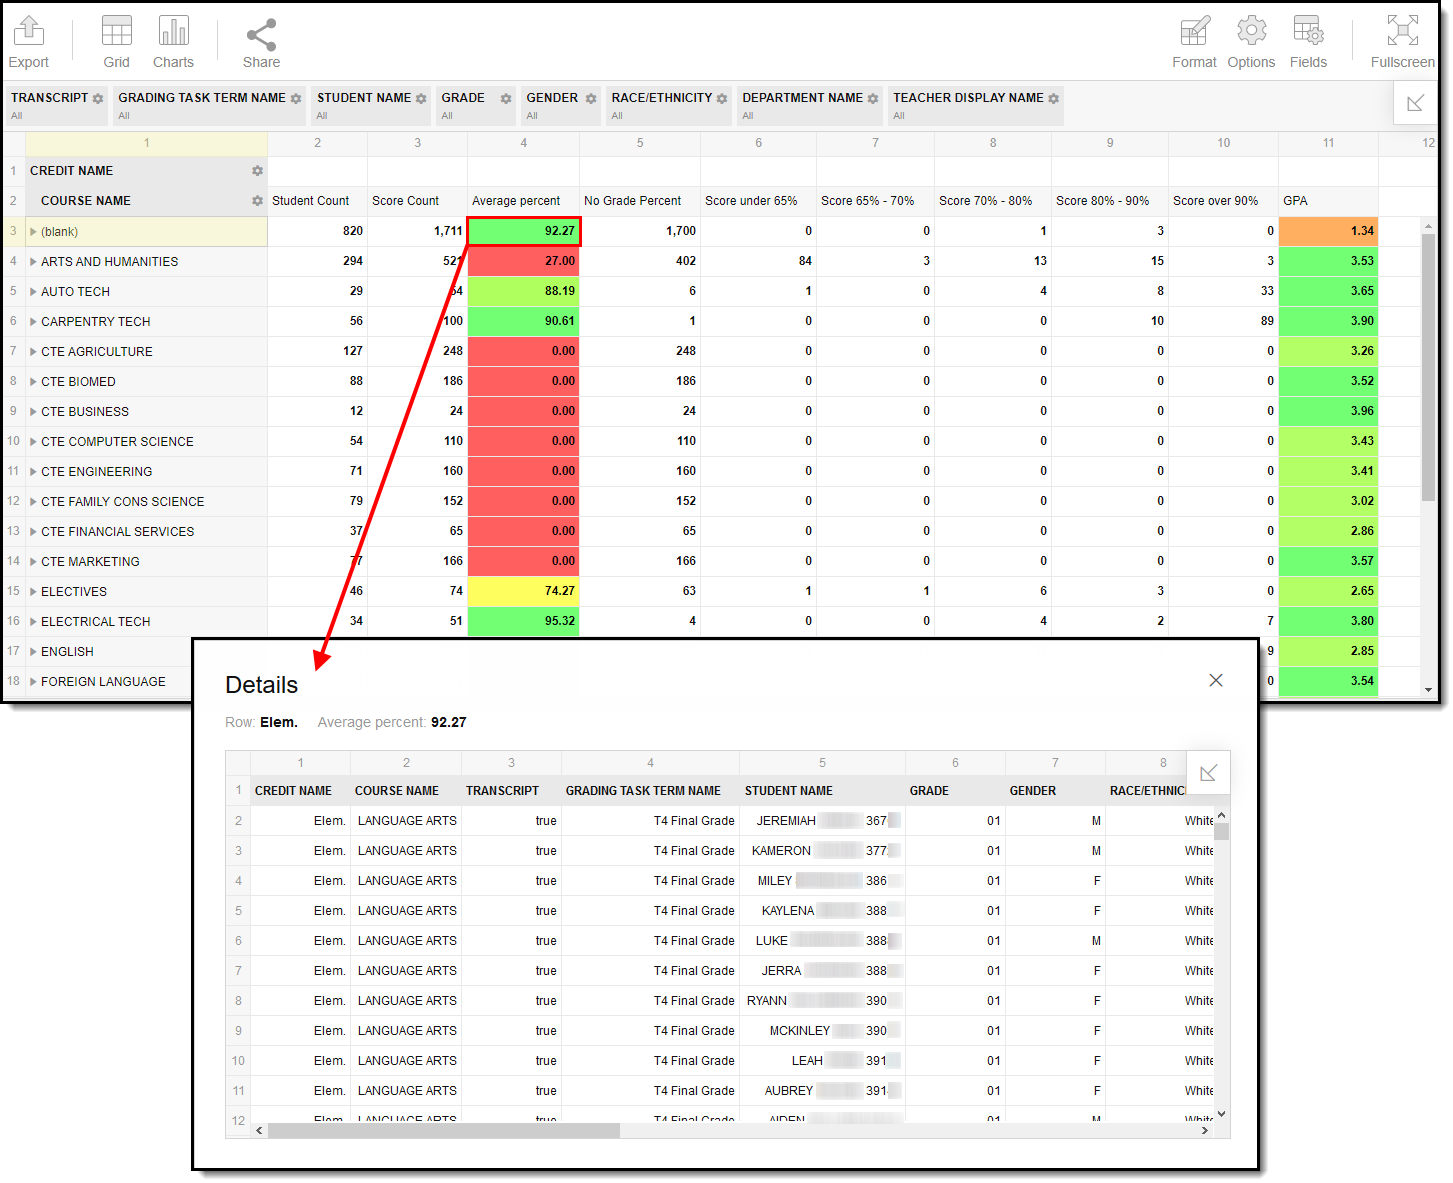
The Grade Analysis Report summarizes transcript credit data by credit name. It includes:
- Student counts per credit
- Total scores
- Average score percentages
- Records without score percentages
Color coding highlights performance:
- Green indicates higher values
- Red/Orange indicates lower values
The report helps you evaluate overall student performance by course and drill down into detailed student-level data.
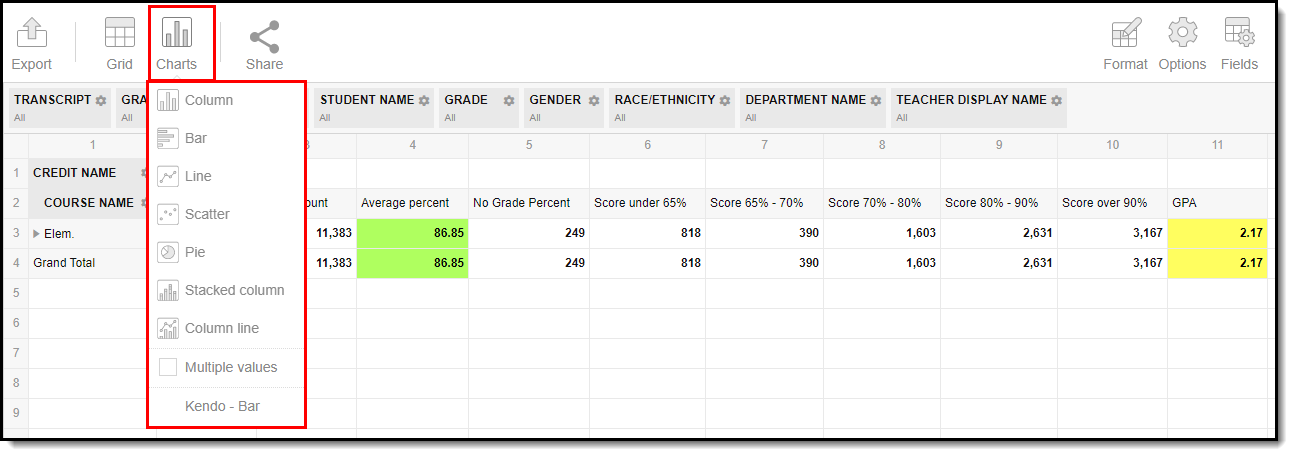
Report data can also be displayed in numerous useful charts/graphs by clicking the Charts button and selecting an option.
Filter and modify the report
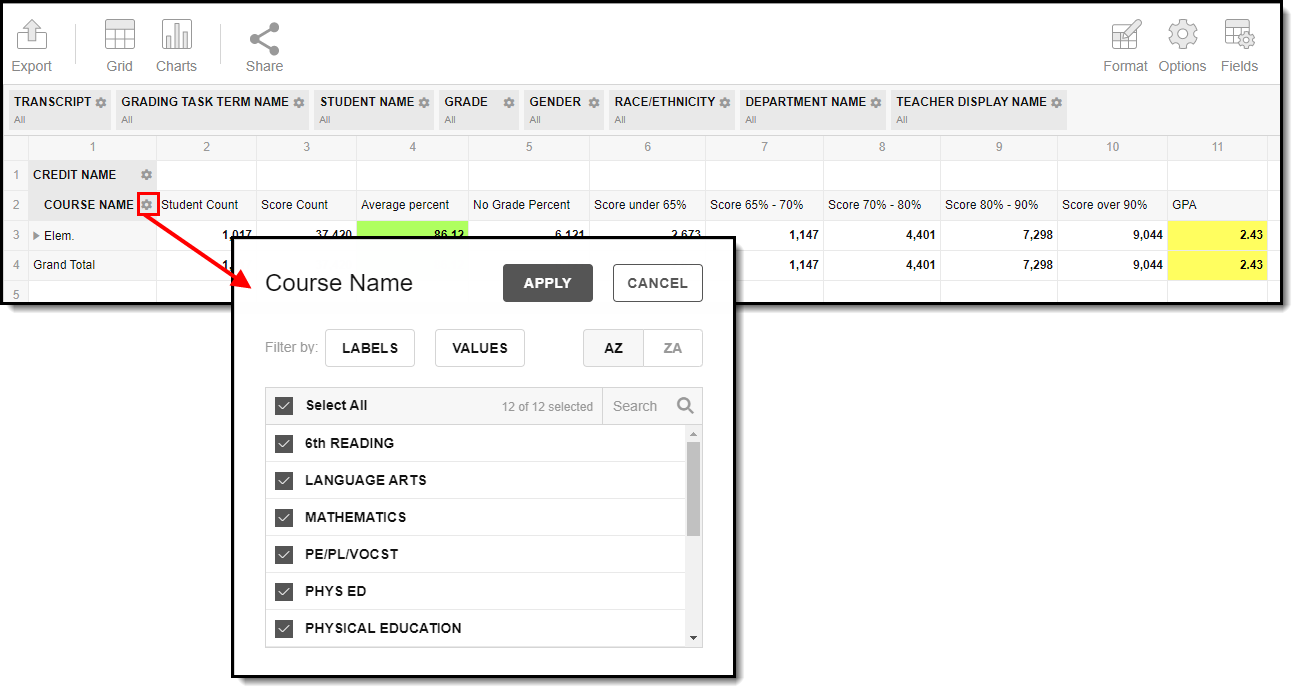
Filter dimensions
- Click the gear icon next to a dimension header.
- Filter by label or value.
- Adjust the sort order as needed.
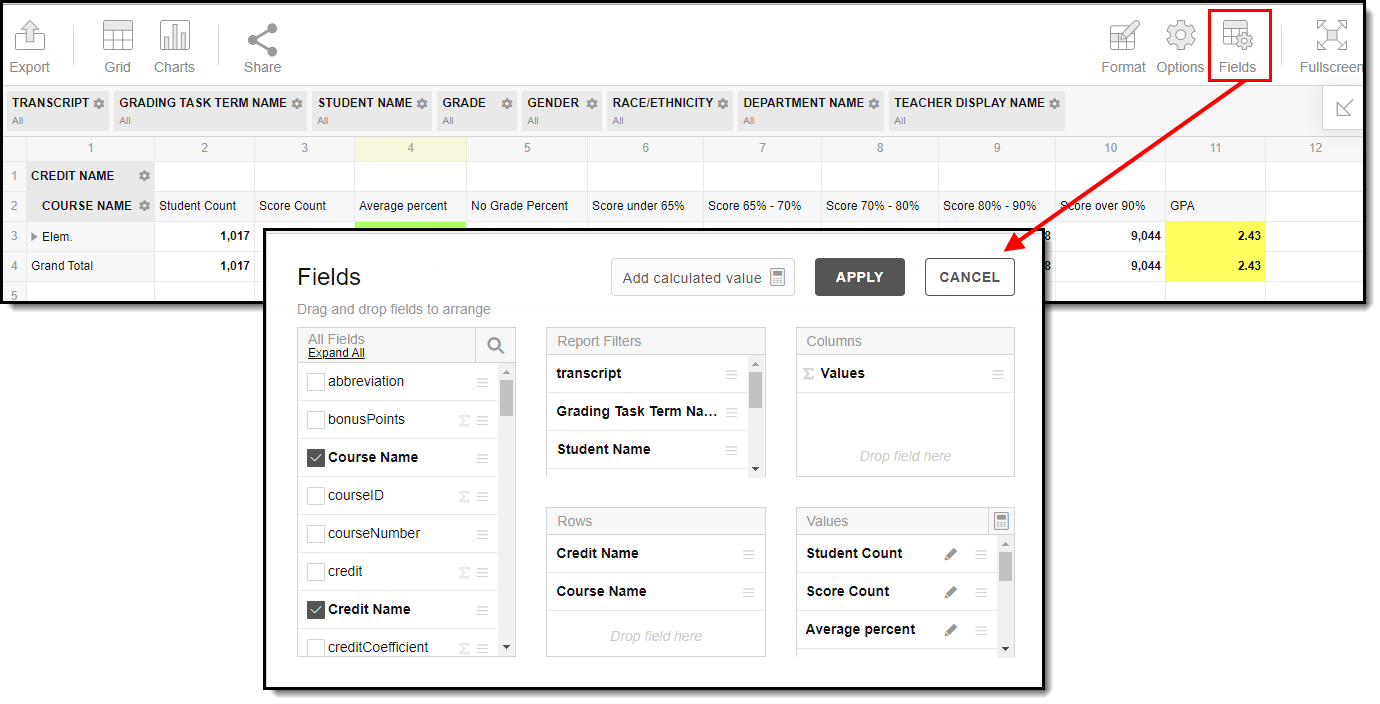
Modify fields
- Click the Fields icon.
- Reorder fields, add or remove fields, or change row/column placement.
Add calculated values
- Click Add calculated value.
- Enter a formula using supported aggregation keywords.
Format and adjust layout
Format options let you modify how cells display data in the pivot table.

Format cells
- Click Format > Format cells.
- Configure:
- Text alignment
- Display values and decimals
- Symbols
- Null values
- Percentage display
Apply conditional formatting
- Click Format > Conditional formatting.
- Set thresholds and adjust font or text size.
Adjust layout
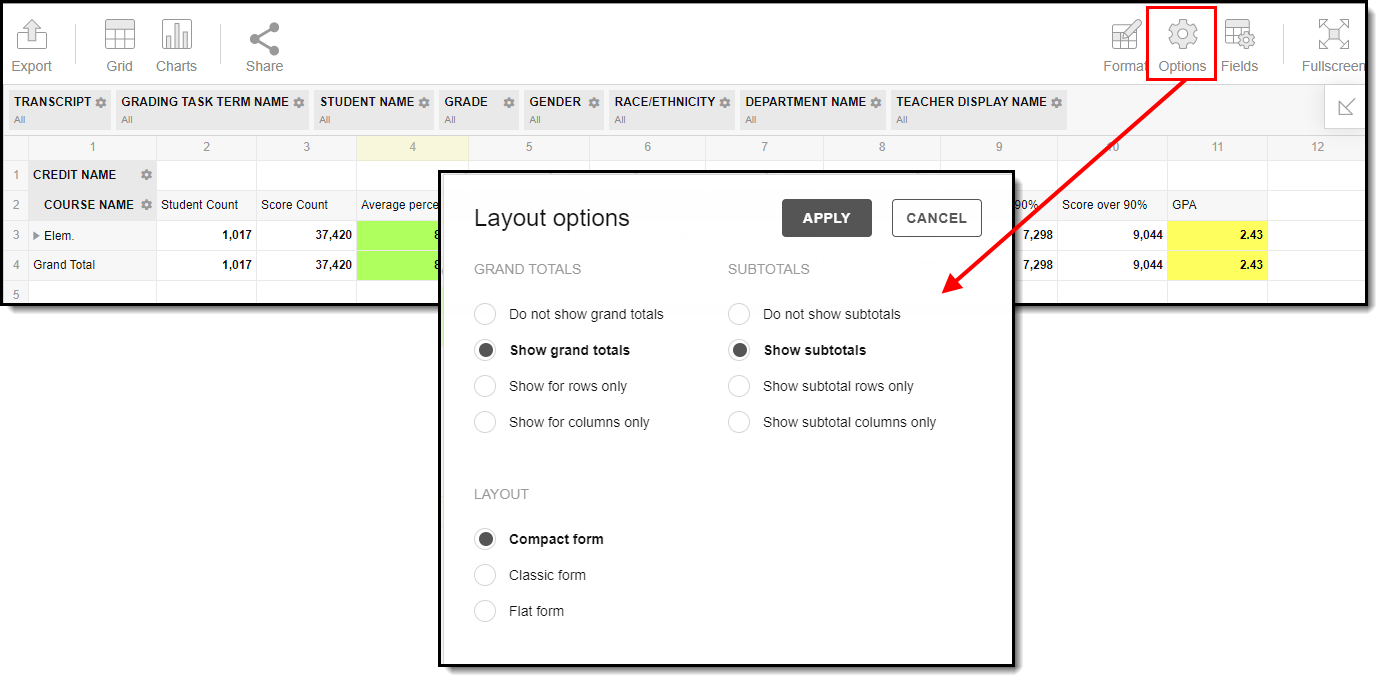
Use the Options menu to configure:
- Table layout
- Grand totals
- Subtotals
Export and share the report
The report (pivot) can be exported to several formats by clicking the Export icon and selecting an option. 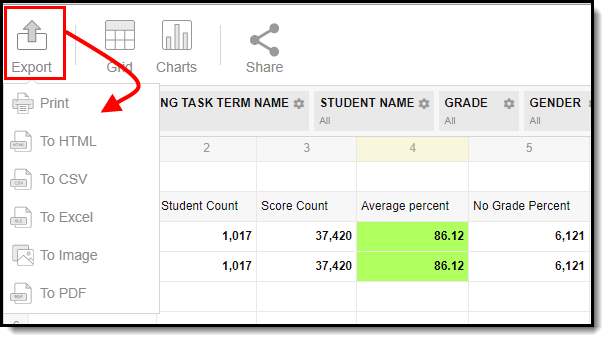
Export
- Click the Export icon.
- Select a file format.
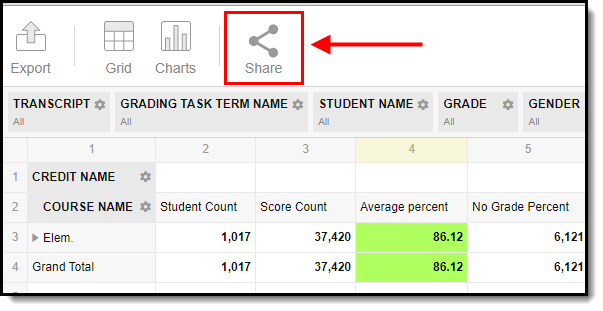
Share
- Click the Share icon.
- Copy and distribute the report URL.
Users attempting to access a pivot table via a shared URL must first be logged in to Infinite Campus and have the proper calendar rights to view the reported data.