Tool Search: Grade Book
The scoring analysis options available in the Grade Book differ based on whether the task you're scoring uses Points/Marks or Rubrics.
You can score standards with any of the three options, but grading tasks can only be scored with Points or Marks.
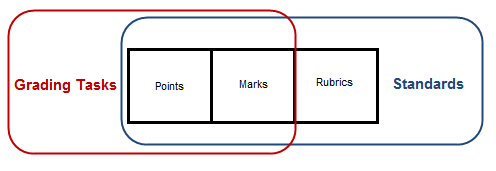
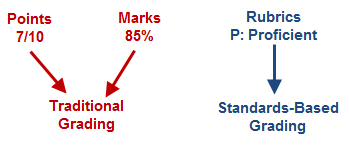
Points and Marks express student performance as a number, such as 7/10 points or 85%. Rubrics describe the quality of student performance, such as Developing or Proficient.
Points and Marks represent "traditional grading," whereas scoring with rubrics applies a "standards-based" approach.
Options Available for Standards-Based Grading
Standards are scored using Rubrics, which measure proficiency rather than assigning a numeric score to the student's performance, but they can also be scored with Points or Marks. This article describes scoring analysis options specifically for Rubrics.
Calculating grades based on these proficiency scores is determined by the options selected for the standard in the Grade Calculation Options, which must be established for In Progress proficiency estimate to calculate.
The following sections describe:
- Sparkline Graphs, which summarize individual student performance.
- Proficiency Graphs , which display student performance in relation to other students in the section.
- The Proficiency Distribution that displays for an assignment or category.
- The Grade Totals section that includes In Progress calculations and posted grades.
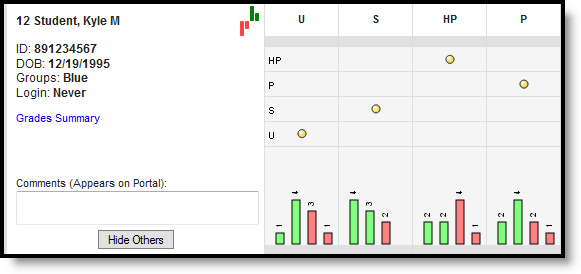
Sparkline Graphs
If you've set the Sparkline Graph preference, a green and red sparkline graph displays next to the student's name. This graph displays condensed student performance data based proficiency scores, with each bar representing one assignment along an axis of proficiency and the height of each bar based on the number of rubric score options. Passing scores show as a green bar and go upwards from the axis, while failing scores show as a red bar and go down from the axis. This graph is always displayed chronologically, regardless of assignment sort options.
Hover over the sparkline graph to view a tool tip indicating the number of scores represented in the graph.

Sparkline Graph Example
In this example, there are four score options, two considered Proficient: HP: Highly Proficient, P: Proficient, and two considered Not Proficient: S: Improving, and U: Unsatisfactory.
Displaying a graph for a standard that has many assignments may cause student names to be hidden behind the graphs. If this occurs, turn off the preference to show graphs.
Proficiency Graphs
In place of the Box and Whisker diagrams shown for assignments scored with Points/Marks, Standards scored with Rubrics display graphs in the expanded Student area, one displaying a student's proficiency over time and the other showing the proficiency distribution across all students in the section.
Proficiency Graph Examples
The Student Proficiency graph depicts student proficiency across all Rubric proficiency levels. The Proficiency Distribution graph aggregates how many students were scored at each proficiency level across the section, from the score with the highest sequence to the lowest.
Note: The proficiency graph does not display for standards scored using rubrics with more than 20 options.
Proficiency Distributions
Hover over an assignment header to view the proficiency distribution tool tip, which includes the possible proficiency levels and the distribution of all students across the proficiency levels.
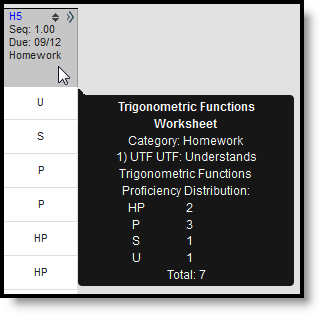
Proficiency Distribution Across the Section for an Assignment
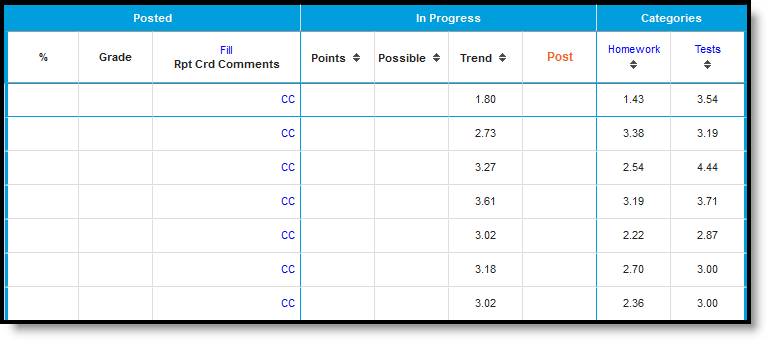
Rubric-Based Grade Totals
For assignments scored using Rubrics, In Progress proficiency estimates are calculated based on the Proficiency Estimate option selected for the Term/Standard in Grade Calculation Options. These columns include Posted and In Progress as well as a calculated value per assignment Category.
In Progress values calculate automatically based on scores entered and cannot be directly modified. Posted grades appear on the student's Grades tab. Grades in the Posted column can be modified as desired by the teacher; updated grades post upon save.
Columns and calculations in the In Progress section differ based on the Proficiency Estimate option selected.
| Proficiency Estimate Calculation | Description |
|---|---|
| Highest Score | Indicates the highest proficiency level the student has achieved. Sequence must be entered for items on the Rubric for this option to calculate correctly. |
| Mode of 3 | Indicates the most common score for the student across the most recent three scores. |
| Mode of 5 | Indicates the most common score for the student across the most recent five scores. |
| Power Law | Power Law is a mathematical calculation that converts proficiency levels into numeric values and determines a trend based on the student's scores, locating the student between introduction and full mastery. See the Posting Grades article for information about using Power Law. |
| Most Recent | Indicates the most recent proficiency level the student has achieved, based on assignment due date. If the most recent due date has multiple assignments, those assignments must have sequence values to report a Most Recent proficiency estimate. The most recent value calculates from the assignment with the highest sequence number on that day. |
Use ALT L to expand and collapse this area.
In Progress Proficiency Estimate when using Power Law
In Progress proficiency estimates are available for students to view on the Portal. Posting Grades is the action of publishing grades to the transcript.
Categories
A column displays for each Category in the Term and Task selected. Each category calculates a based on the grade calculation option selected.
Categories marked as Exclude still have a proficiency trend calculated but are not included in the In Progress calculations. Excluded categories appear in red text.
In Progress Proficiency Estimates
When using Rubrics-based scoring, the Points and Possible columns remain blank.
Hover over the student's trend value/proficiency estimate to view a tool tip with all four proficiency calculations.
When using Power Law:
A Trend estimate calculates in the In Progress section based on the trend calculations for each Category. This trend value represents the student's progress as a numerical value on a scale where each "point" aligns to a rubric score. For example, on the four value rubric described above, a trend value of 2 would align to a proficiency level of S, and a 4 would align to HP.
When using Highest Score, Mode of 3 or Mode of 5:
The Proficiency Estimate calculates based on the grade calculation option selected for the standard.
Posted Grades
When posting grades for rubric-based tasks using Power Law, enter grades manually. Otherwise the Proficiency Estimate calculates. See the Posting Grades article for more information about posting grades.
Automatic posting means clicking Post moves the In Progress proficiency estimate to the Posted column. Manual means that the teacher is responsible for analyzing the data and determining the student's performance. The posting options available depend on the grade calculation options selected for the standard.
| Grade Calculation Option Chosen | Posting Options | |
| Manual | Automatic | |
No Calculation | X |
|
Proficiency Estimate - Highest, Mode of 3, Mode of 5 | X | X |
Proficiency Estimate - Power Law | X |
|
