Tool Search: Class Size Average (K-12) Report
The Class Size Average (K-12) Report calculates and projects average class enrollment for an entered date range or for the entire year. It also includes or excludes (default choice) students in active Independent Study programs as marked on the student's enrollment record. The report can be generated for one grade level or for multiple grade levels.
 Class Size K-12 Report
Read - Access and generate the Class Size Average (K-12) Report.
Write - N/A
Add - N/A
Delete - N/A
For more information about Tool Rights and how they function, see the Tool Rights article.
Best Practice
To generate this report for the purpose of seeing the J-7 Class Size Reduction YTD Average, use the first day of school as both the From and To dates in the Date Range fields and April 15 as the Report Date. YTD Average reports for the J-7 Extract. Doing this allows the report to be generated on the future values but not generate as many report pages.
Report Logic
The following record population rules apply:
- Courses in which students are enrolled during the entered date range on the report editor report.
- The active teacher(s) during the date range selected on the report editor report.
- The Include IS Student checkbox on the editor indicates whether students in Program 111 or 170 (Independent Study) are included in the student count. When marked, those students report; when not marked (default selection), they do not report.
The following business rules apply:
- Course sections can be selected by either the teacher name or the course section name.
- Students marked as State Exclude or in a grade level marked as State Exclude are counted in class roster counts.
- Data reports for each date within the range. An empty row displays between records for individual course sections.
Teachers display in the Teacher/Section list based on the selected calendar. If the teacher had an active District Assignment record within the selected calendar, information reports for that teacher if the district assignment is active during the entered date range.
If the District Assignment record ended before the date range, the teacher does not report. If the District Assignment record begins after the entered date range, the teacher does not report.
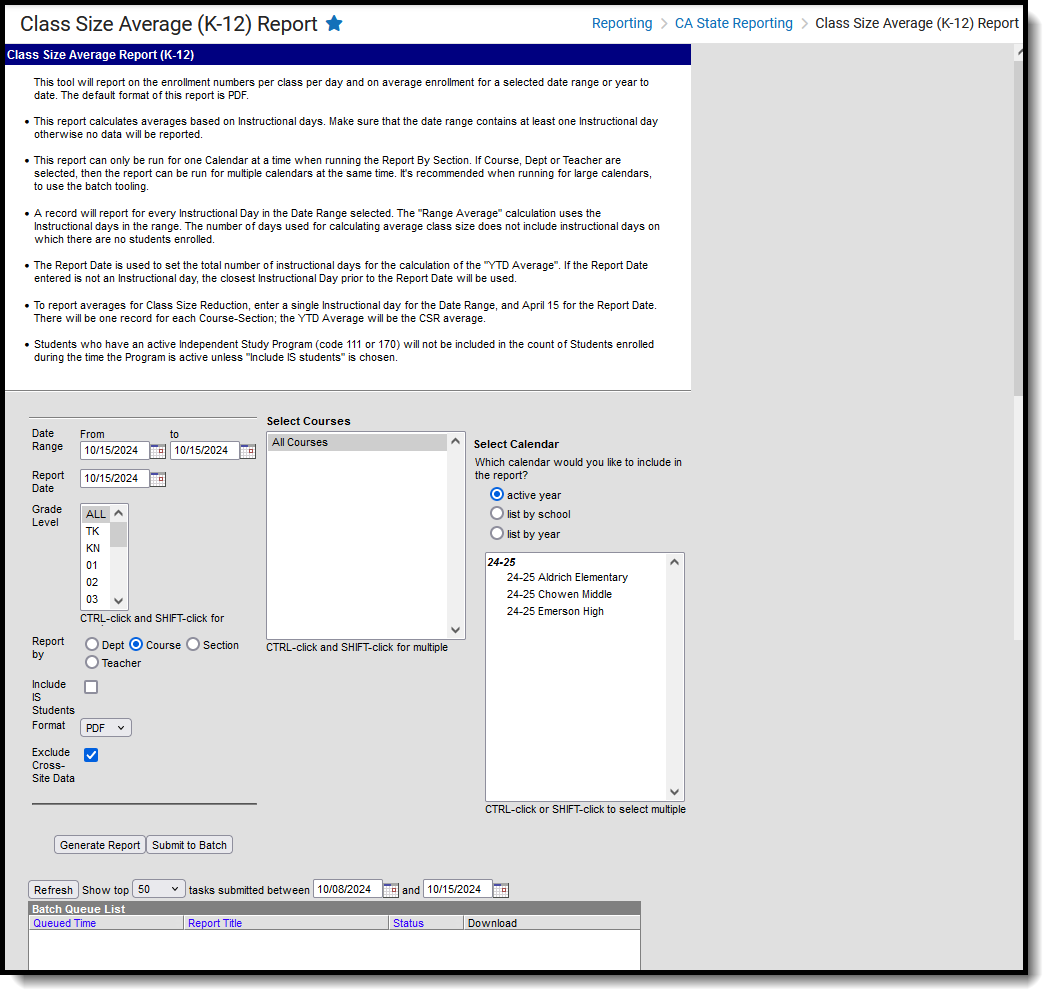
Report Editor
Field |
Description |
|---|---|
Date Range |
Class roster data as of the entered From date and the To date reports. Dates are entered in mmddyy format or can be entered by selecting the calendar icon to choose a date. The date range must include as least one instructional day in order for data to be reported. |
Report Date |
This date sets the total number of instructional days for the calculation of the YTD Average. If the report date entered is not an instructional day, the closest instructional day prior to the report date is used. Dates are entered in mmddyy format or can be entered by selecting the calendar icon to choose a date. The end date of the Date Range is selected by default but can be changed. |
Grade Level |
Select at least one grade level from the list. "All grades" is the default. Since the report requires the selection of a calendar in the Campus toolbar to return data, select those grade levels in the selected calendar. |
Report By |
Determine how to report the information by choosing one of the following:
|
Include IS Students |
When marked, students in Programs 111 or 170 (Independent Study) are included in the counts. |
| Exclude Cross-Site Data | When marked, students enrolled in Cross-Site Enrollment courses are not included in the report. |
Format |
The report can be printed in either PDF format or CSV format. |
Select Course Departments/Courses/Section/Teacher |
Select which departments, courses, sections or teachers (depending on the Report By selection) to include in the report. |
| Calendar Selection | Select from which calendar to report class size information. When generating the report by Department, Course or Teacher, multiple calendars can be selected; when generating the report by Section, only one calendar can be selected. Calendars marked as Exclude on the Calendar Information editor are NOT available for selection. |
| Report Generation | Because of the size of the report and the amount of data that could be returned, users can choose to generate the report immediately using the Generate Report button. Or, to generate the report at a later time (maybe after school hours), the report can be generated using Batch Queue functionality. |
Generate the Report
- Enter the Date Range for the report. Both a From date and a To date are required.
- Enter a Report Date.
- Select a Grade Level or multiple grade levels to include in the report.
- Select the desired Report By option.
- Mark the Include IS Students checkbox, if desired.
- Mark the Exclude Cross-Site Data checkbox to remove students enrolled in Cross-Site courses from the report.
- Select the desired Format of the report.
- Select the desired Department, Courses, Sections or Teacher Names. This list changes based on the selected Report By option.
- Select the desired Calendar from which to report information.
- Click the Generate Report button or the Submit to Batch button. The report displays in a new browser window in the selected format.
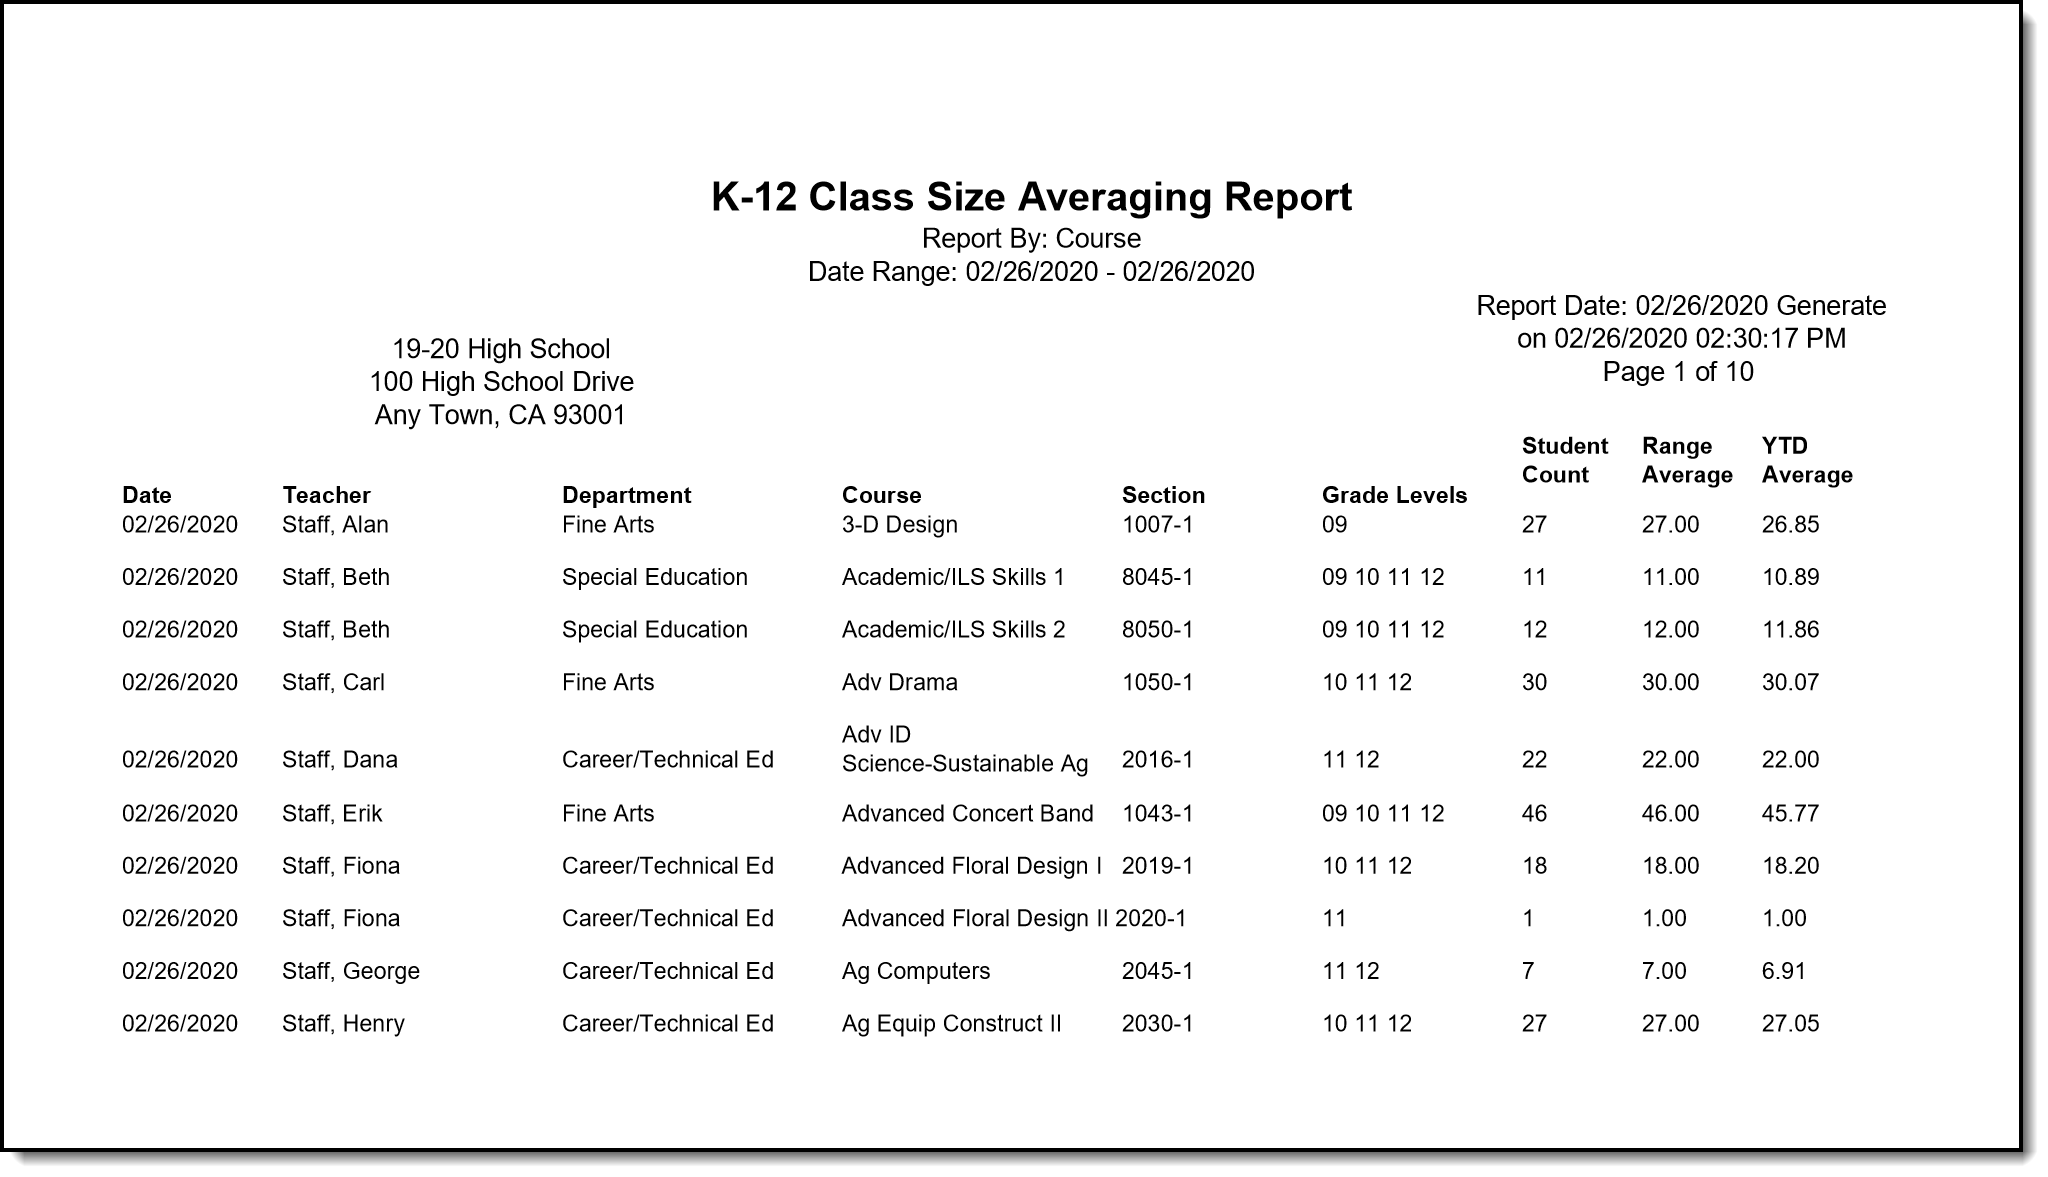 Class Size Average Report, PDF Format
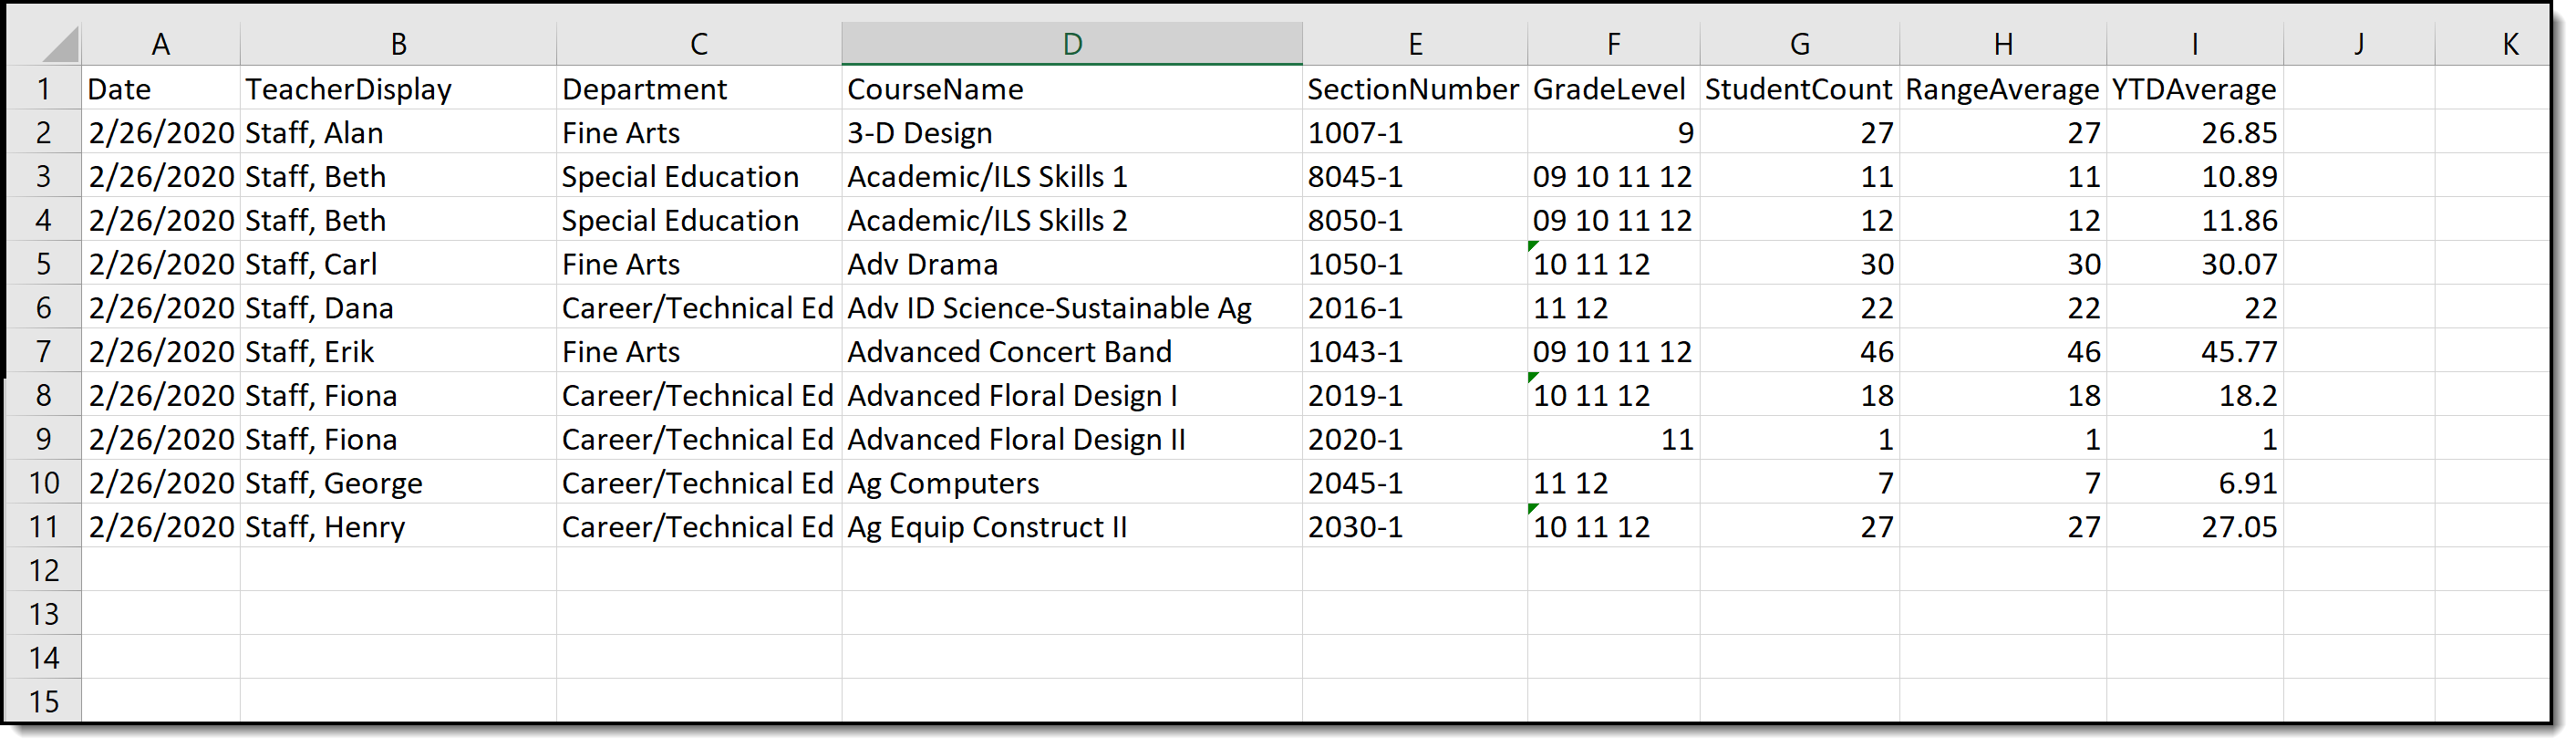 Class Size Average Report, CSV Format
Class Size Average Report Layout
Data Element |
Description |
Location |
|---|---|---|
Date |
Reports the date of each instructional day entered in the extract editor. Date format, 10 characters (DD/MM/CCYY) |
Day Setup > Instruction
Calendar.date |
Teacher |
The active Primary Teacher during the date range. When the Primary Teacher changes during the date range, the reported teacher also changes.
Alphanumeric, 30 characters |
Section Staff History > Primary Teacher
SectionStaffHistory. staffType |
| Department | The name of the department assigned to the course.
Alphanumeric, 30 characters |
Course Information > Department
Course.department |
Course |
The name of the course.
Alphanumeric, 30 characters |
Course Information > Name
Course.name |
Section Number |
Number of the section.
Alphanumeric, 3 characters |
Course Information > Section > Number
Section.number |
Grade Levels |
Reports the grade level(s) of the reportable students actively enrolled in the course section as of the date range.
When a student changes grade levels during the date range, both grade levels are reported.
Alphanumeric, 3 characters |
Enrollments > General Enrollment Editor > Grade
Enrollment.grade
|
Student Count |
Count of the students on the roster on the report date, minus any student with an active Program 111 or 170 UNLESS the Include IS checkbox is marked.
Numeric, 3 digits |
Calculated, data not stored |
Range Average |
The sum of the Student Count field for each date in the range is divided by the number of instructional days in the date range into two decimal places.
Numeric, 4 digits |
Calculated, data not stored |
YTD Average |
The sum of the number of students enrolled in the section on every instructional day in which the section is scheduled, up to and including the entered Report Date on the extract editor, divided by the number of Instructional Days from the first instructional day the section is scheduled to the Report Date.
Numeric, 4 digits |
Calculated, data not stored |
