Tool Search: Continuation Attendance
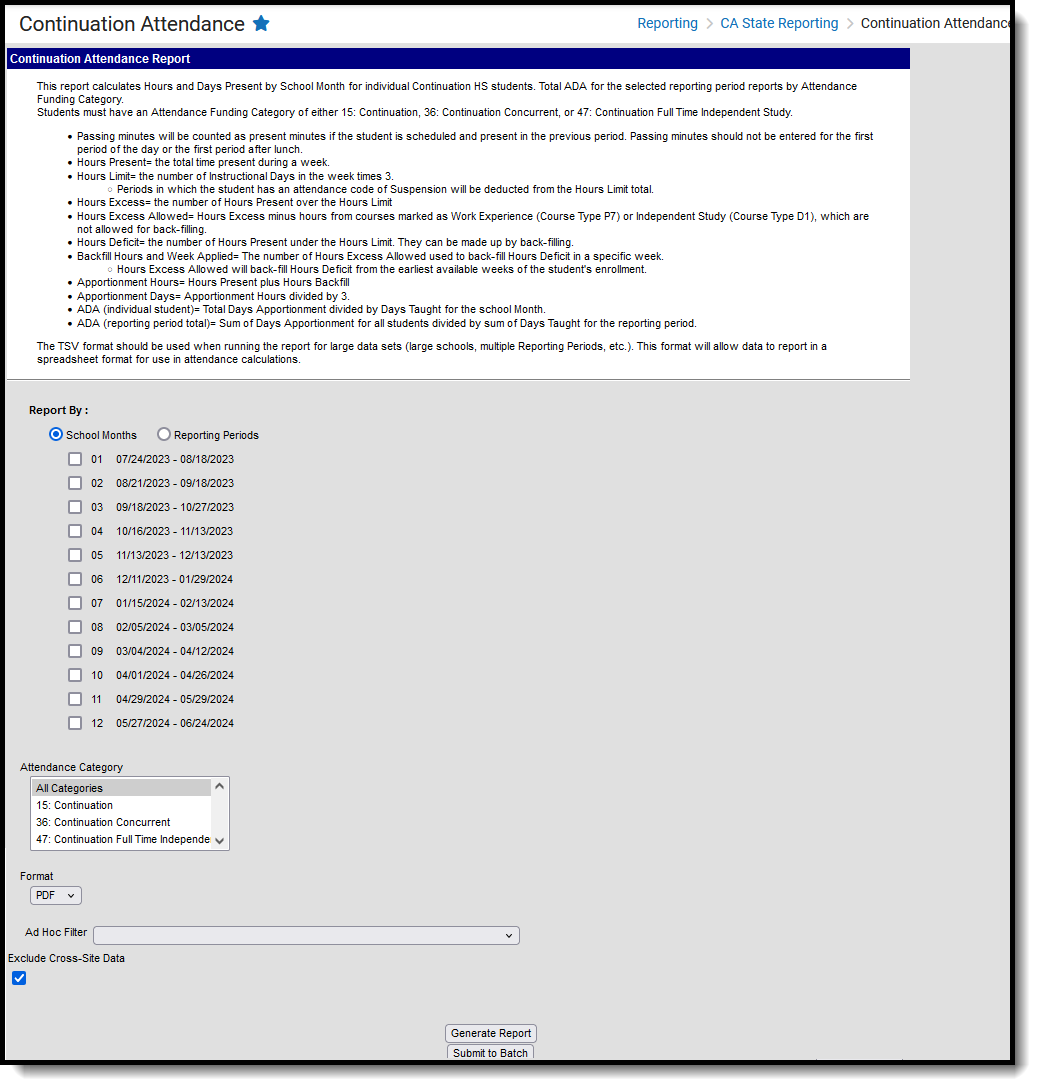
The Continuation Attendance Report calculates hours and days present by school month for individual continuation high school students. Report data by School Months or by Reporting Periods.
A calendar must be selected in order to generate the report.
 Continuation Attendance
Read - Access and generate the Continuation Attendance Report.
Write - N/A
Add - N/A
Delete - N/A
For more information about Tool Rights and how they function, see the Tool Rights article.
Report Logic
Students who have an active enrollment record for any part of the selected school month or reporting period and an Attendance Funding Category of 15, 36 or 47 report (chosen on the report editor). Total Average Daily Attendance (ADA) reports for all students in each selection Attendance Funding Category group and as a total for all groups.
Students are not included in the report when:
- Their enrollment is marked as State Exclude or as No Show.
- They are enrolled in a grade level marked as State Exclude.
- They are enrolled in a calendar marked as State Exclude.
Report Editor
| Field | Description |
|---|---|
| Report by School Months or Reporting Periods |
Selection determines how a report generates.
|
| Attendance Funding Categories |
Indicates which Attendance Funding Categories are included in the report. Choose All Categories or one of the three available:
|
| Format |
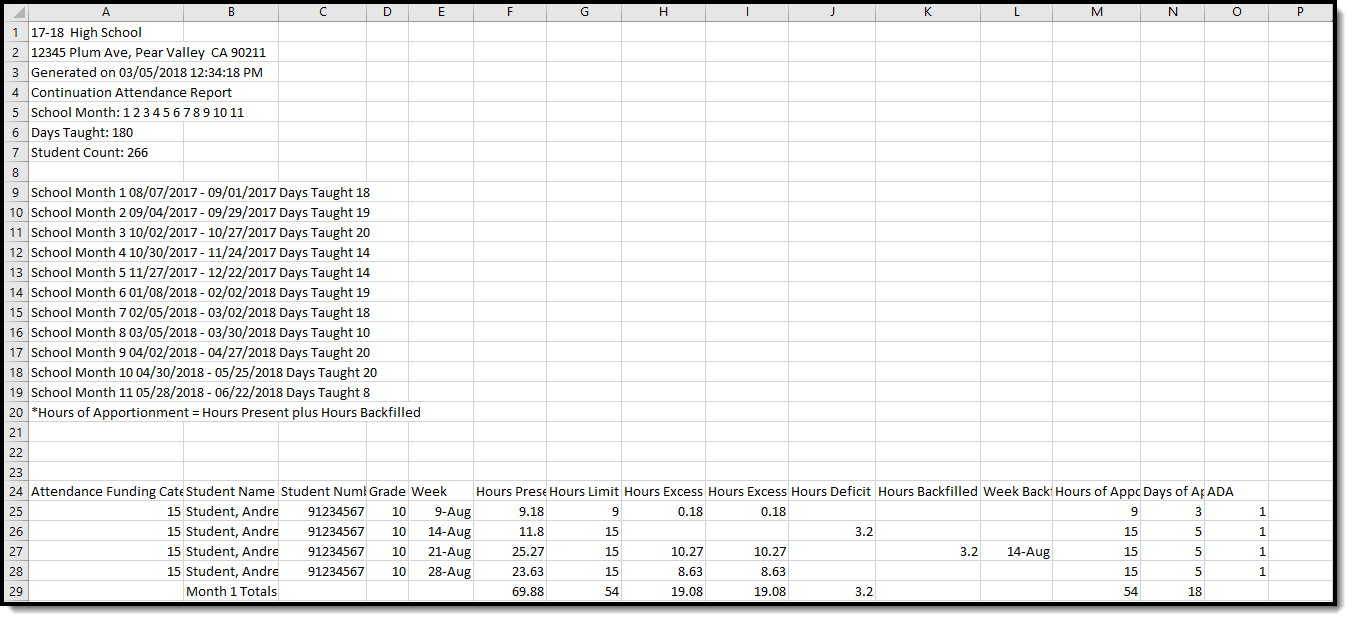
The report can be generated in PDF, TSV, or CSV format. Use the TSV format when generating the report for large schools, multiple reporting periods, etc. |
| Ad hoc Filter | Select an Ad hoc filter to narrow the student list. Only those students included in the filter (and who match other reporting logic and business population requirements) are included in the report. |
| Exclude Cross-Site Data | When marked, students enrolled in Cross-Site Enrollment courses are not included in the report. |
| Report Generation | Generate the report immediately using the Generate Report button. Use the Submit to Batch button to choose when the report generates. Submit to Batch can be used when large data sets are chosen (multiple school months, larger calendars, etc.). |
Generate the Report
- Choose the Report By option of School Months or Reporting Periods.
- If choosing School Months, mark which School Months to include.
- If choosing Reporting Periods, choose P1, P2, Annual, 19-20 P2 or 19-20 Annual.
- Select which Attendance Category to include in the report.
- Select the desired Format of the report.
- Select an Ad hoc Filter, if desired.
- Mark the Exclude Cross-Site Data checkbox to remove students enrolled in Cross-Site courses from the report.
- Click the Generate Report button to display the results of the report immediately. Or, click the Submit to Batch button to select when the report generates.
Report Layout
| Data Element | Description | Location |
|---|---|---|
| Attendance Funding Category |
Lists the funding category(ies) selected in the report editor.
When All Categories or multiple categories are selected, student records group by funding category.
Alphanumeric, 30 characters |
N/A |
| Student Name | Reports the student's Last Name, First Name, Middle Initial.
Alphanumeric 50 characters |
Identities > Person Information > Last Name, First Name, Middle Name
Identity.lastName Identity.firstName Identity.middleName |
| Student Number | Reports the locally assigned student number.
Numeric, 8 digits |
Demographics > Person Identifiers > Student Number
Person.studentNumber |
| Grade | Reports the student's grade level of enrollment during the selected school month or reporting period.
Numeric, 2 digits |
Enrollments > General Enrollment Information > Grade Level
Enrollment.grade |
| Attendance Category | Displays the student's attendance funding category.
Alphanumeric, 20 characters |
Enrollments > State Reporting Fields > Attendance Funding Category
Enrollment. attendanceFundingCategory |
| Week | Displays the Month/Day for the Monday of each week in the selected School Month.
Date Field, 5 characters (MM/DD) |
Calendar > School Month |
| Hours Present |
Reports the number of hours the student is present in the selected school month.
This is the count of the total number of minutes present in each schedule instructional attendance taking period, divided by 60.
Passing minutes (entered on the Calendar Periods) are subtracted from the total minutes if the student is not present or if scheduled in the previous period.
A sum of all weeks in the School Month is reported as the Total.
Numeric, 4 digits (NN.NN) |
Calculated value, data not stored |
| Hours Limit |
Reports the maximum number of hours allowed to be reported for apportionment.
This is the number of instructional days in the week times 3.
Instructional days in which the student has an attendance code of SUS (Absent/Excused) for the entire day cannot be used in this calculation. If the student is suspended part-way through the day, before earning 3 hours of presence, the difference is subtracted (3 hours minus hours earned) from the Hours Limit. Instructional Days on which the student is not enrolled cannot be used in this calculation.
This value cannot be greater than 15.00. A sum of all weeks in the School Month is reported as the Total.
Numeric, 4 digits (NN.NN) |
Calculated value, data not stored |
| Hours Excess |
Reports the number of hours present in excess of the hours limit.
This reports only if the hours present is greater than the hours limit; otherwise, no value reports. A sum of all weeks in the School Month is reported as the Total.
Numeric, 4 digits (NN.NN) |
Calculated value, data not stored |
| Hours Excess Allowed |
Reports the number of excess hours that are not from continuation courses.
Present Minutes are subtracted from courses with a Program Funding Category of D1 or P7 from the Hours Excess. If there are no Hours Excess, a blank value reports.
A sum of all weeks in the School Month is reported as the Total.
Numeric, 4 digits (NN.NN) |
Calculated value, data not stored |
| Hours Deficit |
Reports the number of hours limit in excess of hours present (Hours Present minus Hours Limit).
This only reports if the Hours Limit is greater than the Hours Present; otherwise, reports blank.
A sum of all weeks in the School Month is reported as the Total.
Numeric, 4 digits (NN.NN) |
Calculated value, data not stored |
| Hours Backfilled |
Reports the number of Hours Excess Allowed that are used to make up Hours Deficit in a previous week.
Hours Excess Allowed is applied to the earliest week in an enrollment that has Hours Deficit.
Hours Excess is applied to all previous weeks until all are applied. This can be applied to multiple weeks.
A sum of all weeks in the School Month is reported as the Total.
Numeric, 4 digits (NN.NN) |
Calculated value, data not stored |
| Week Back Fill Applied |
Lists the week to which the Hours Backfilled is applied.
This reports the Monday date of the week and repeats for each instance of Hours Backfilled. Date field, 5 characters (MM/DD) |
Calculated value, data not stored |
| Hours of Apportionment |
Reports the hours reports for apportionment. This cannot be greater than the Hours Limit for the week.
This reports Hours Present or Hours Limit, whichever is less.
Hours Present plus any hours backfilled from a future week, if applicable, reports.
A sum of all weeks in the School Month is reported as the Total.
Numeric, 4 digits (NN.NN) |
Calculated value, data not stored |
| Days of Apportionment |
Reports the Hours of Apportionment divided by 3.
This cannot be greater than 5.
A sum of all weeks in the School Month is reported as the Total.
Numeric, 4 digits (NN.NN) |
Calculated value, data not stored |
| ADA |
Reports the student's average daily attendance earned in the school month.
Total Days of Apportionment is divided by the Days Taught.
This cannot be greater than 1.00 for a single school month.
Numeric, 4 digits (NN.NN) |
Calculated value, data not stored |
| Total ADA |
Reports the total average daily attendance for all students and all school months.
Total Days of Apportionment for all students divided by Days Taught.
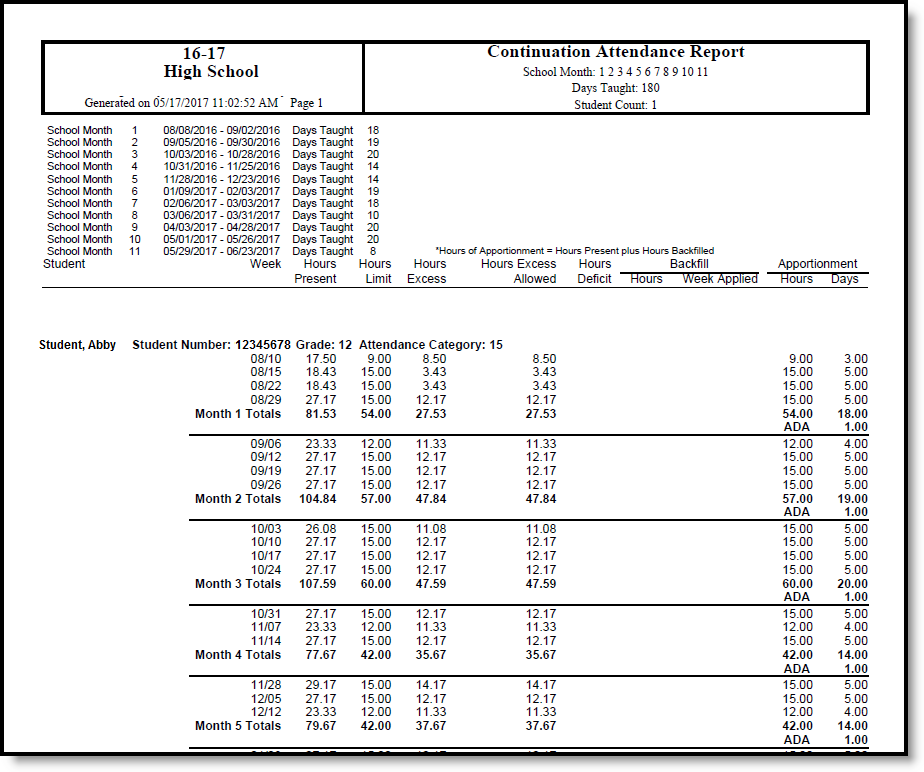
If multiple funding categories are chosen, the Total ADA reports for each AFC and for all Categories at the end of the report.
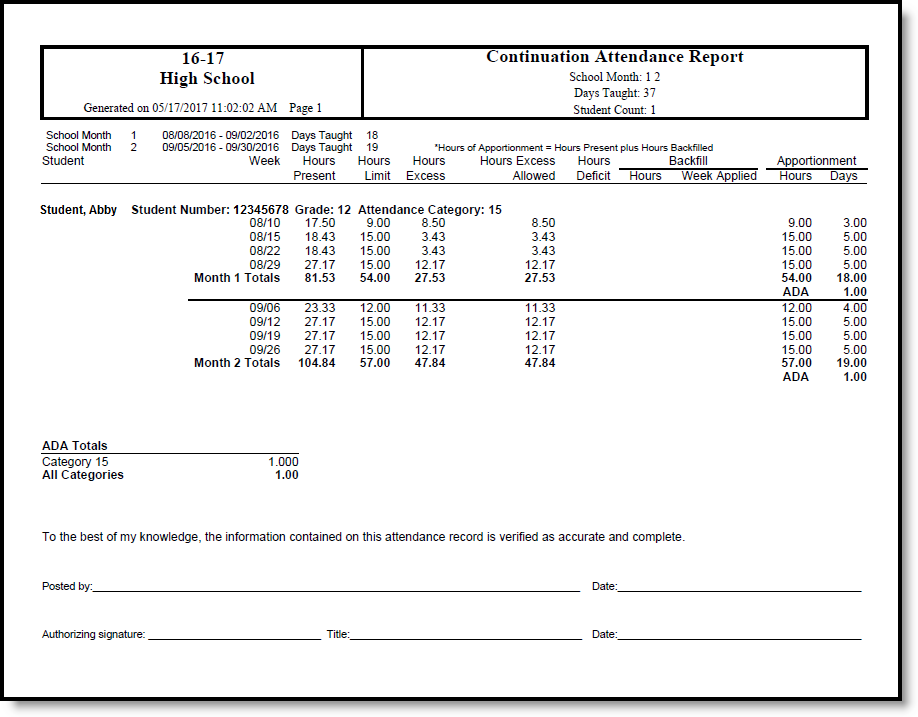
Example: The report is generated for School Months 1 (18 Days Taught) and 2 (19 Days Taught). The Total ADA is derived by summing all of the Days Apportionment for SM 1 and 2 for each student, then dividing by the sum of the Days Taught for SM 1 and 2 (37 Days Taught).
Numeric, 4 digits (NN.NN) |
Calculated value, data not stored |


