Tool Search: Response Extract
The Response Extract allows you to review all responses submitted for a survey, including the ability to filter, print, save, and display responses in a pivot table for further analysis.
 Response Extract
See the Response Extract Tool Rights article for information on available tool rights.
Generate survey responses in a table
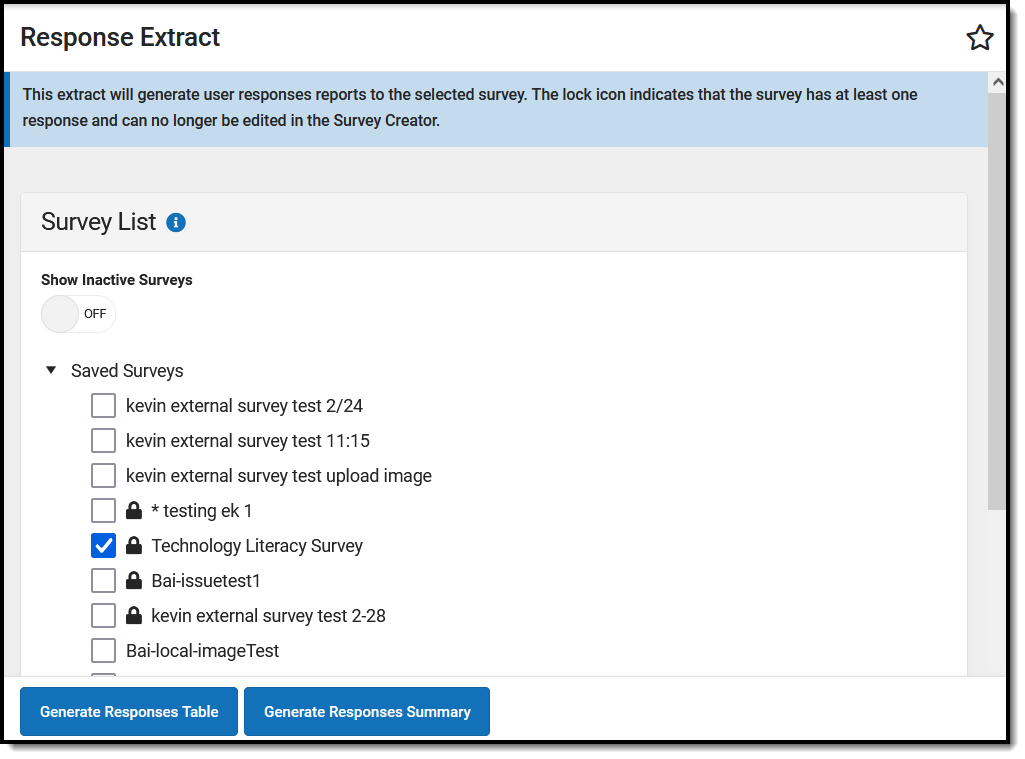
To view survey responses:
- Mark the checkbox next to the desired survey
- Click the Generate Responses Table button.
- The selected survey's responses will appear in a new table editor.
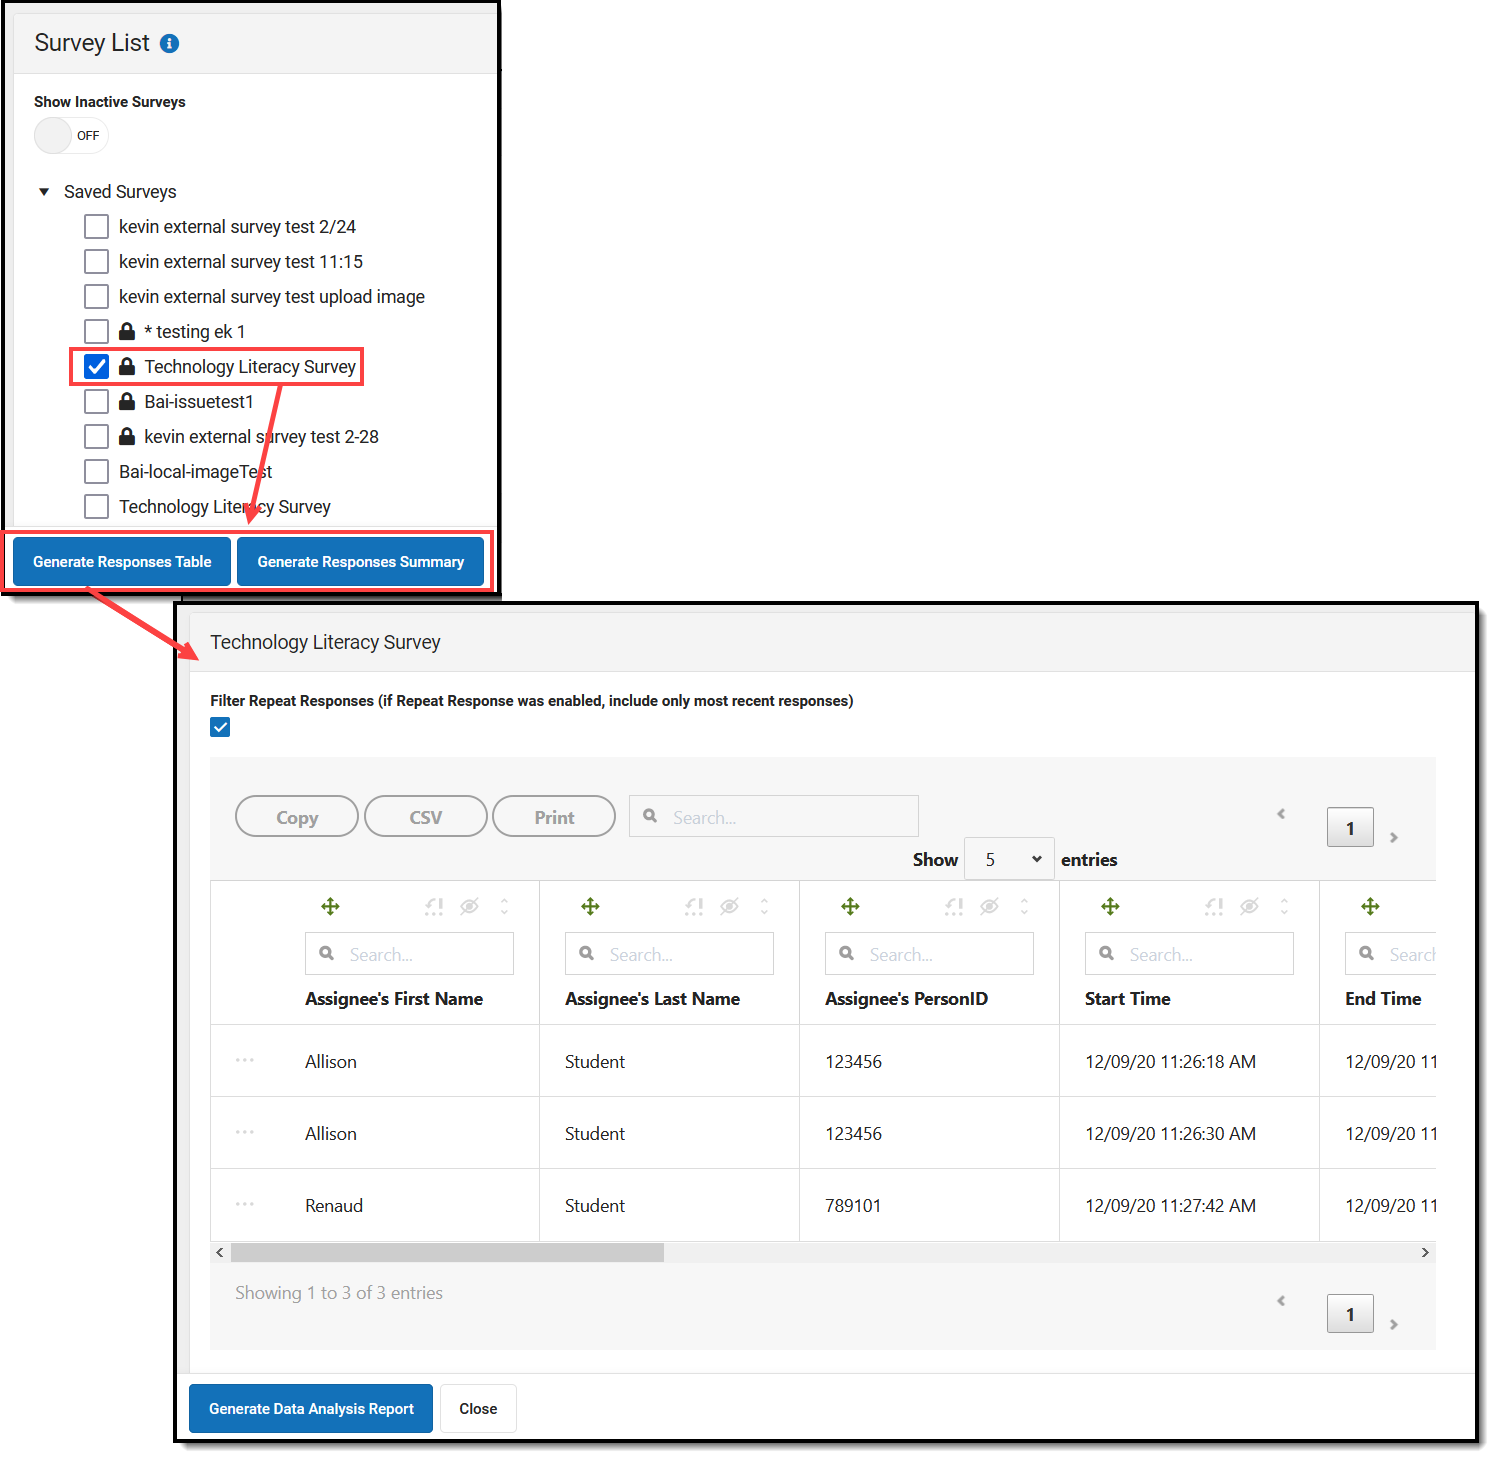
Using this editor, you can copy the data, download the data into a CSV, print the data, and search/filter the data using various features. The table below describes each available option.
Response table field descriptions
| Feature | Description |
|---|---|
| Filter Repeat Responses | If Repeat Responses is enabled for the survey, marking this checkbox will filter responses to only the most recent. |
Copy | Copies all data onto your computer's clipboard. |
CSV | Generates a CSV file containing extract information. |
Print | Allows you to print the extract or save the extract as a PDF. |
Search | Allows you to filter data based on search criteria. |
Move Column | Allows you to drag and move a column to a different position in the data table. |
Move Column to be First Column | Clicking this button moves the column to the first position in the data table. |
Hide Column | Clicking this button will hide the column from the data table. |
Sort Column | Clicking this icon will sort the column data in ascending or descending order (if selected a second time). |
Use the table below for descriptions of each default column in the response table:
| Column | Description |
|---|---|
| Assignee's First Name | The first name of the respondent assigned to take the survey. |
| Assignee's Last Name | The last name of the respondent assigned to take the survey. |
| Assignee's PersonID | The personID of the respondent assigned to take the survey. |
| Start Time | The time the assignee started the survey |
| End Time | The time the assignee ended the survey. |
| Student's First Name | The student's first name if assignee is taking the survey on behalf of the student. |
| Student's Last Name | The student's last name if assignee is taking the survey on behalf of the student. |
| Student's PersonID | The student's personID if assignee is taking the survey on behalf of the student. |
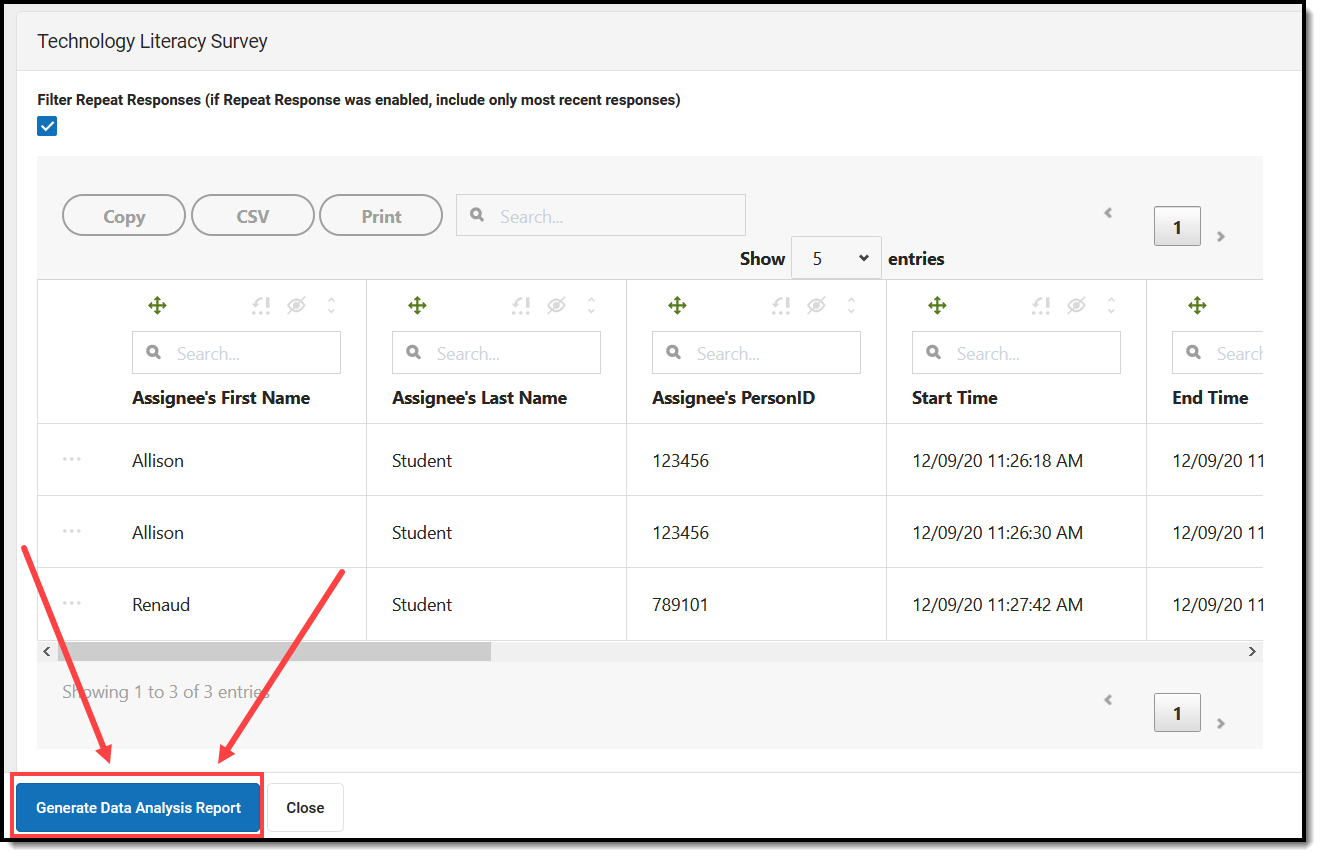
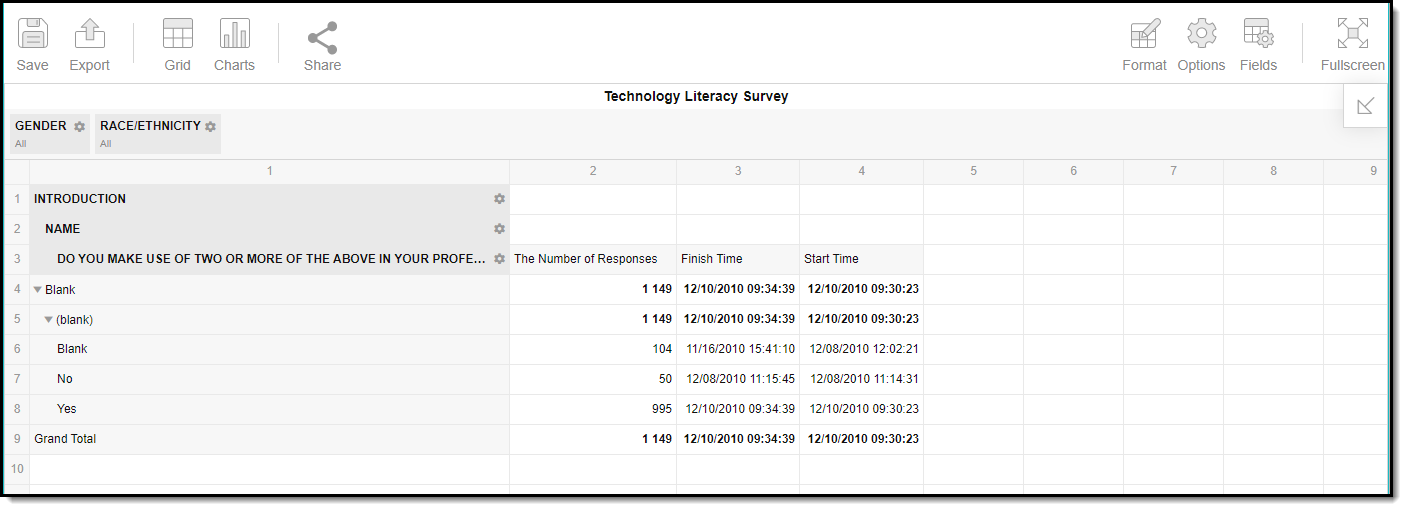
Create a response pivot table
To convert Response Extract data into a Data Analysis pivot table, click the Generate Data Analysis Report button.
For a comprehensive explanation of pivot functionality, please view the following:
Generate responses summary
- To view a summary of survey responses, mark the checkbox next to the desired survey.
- Click the Generate Responses Summary button.
Survey responses will appear in a summary with each question and corresponding answers displayed in a format best suited for each question type:
- Select-type questions display as charts (bar, pie, doughnut, line)
- Range-type questions display as a gauge
- Text questions display as word clouds or a table
To modify the format of a question's responses, select a value in the dropdown lists found under each question.
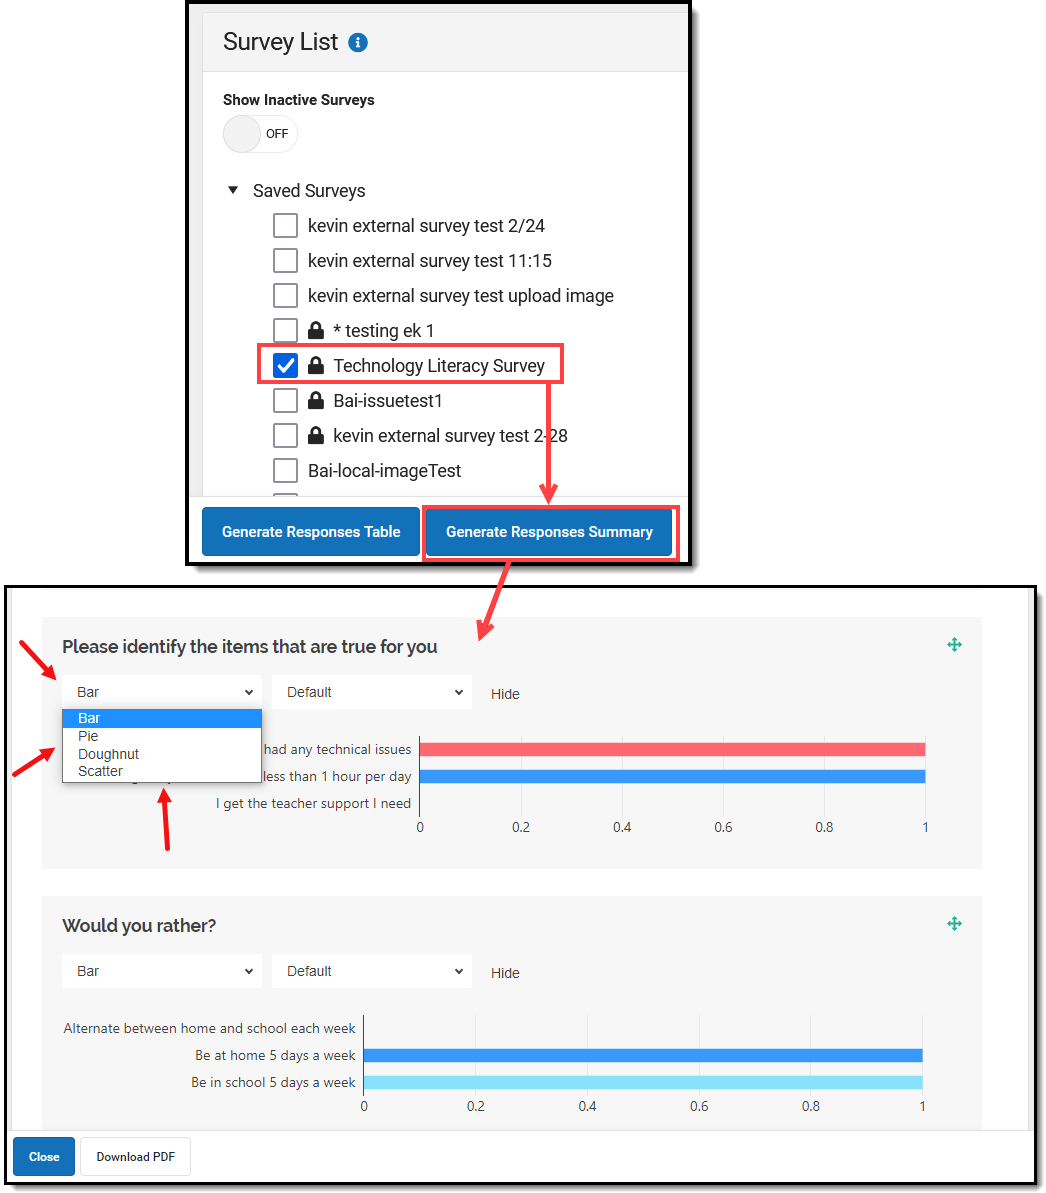
You can also generate a PDF of the summary by clicking the  button.
