Tool Search: Insights Dashboard
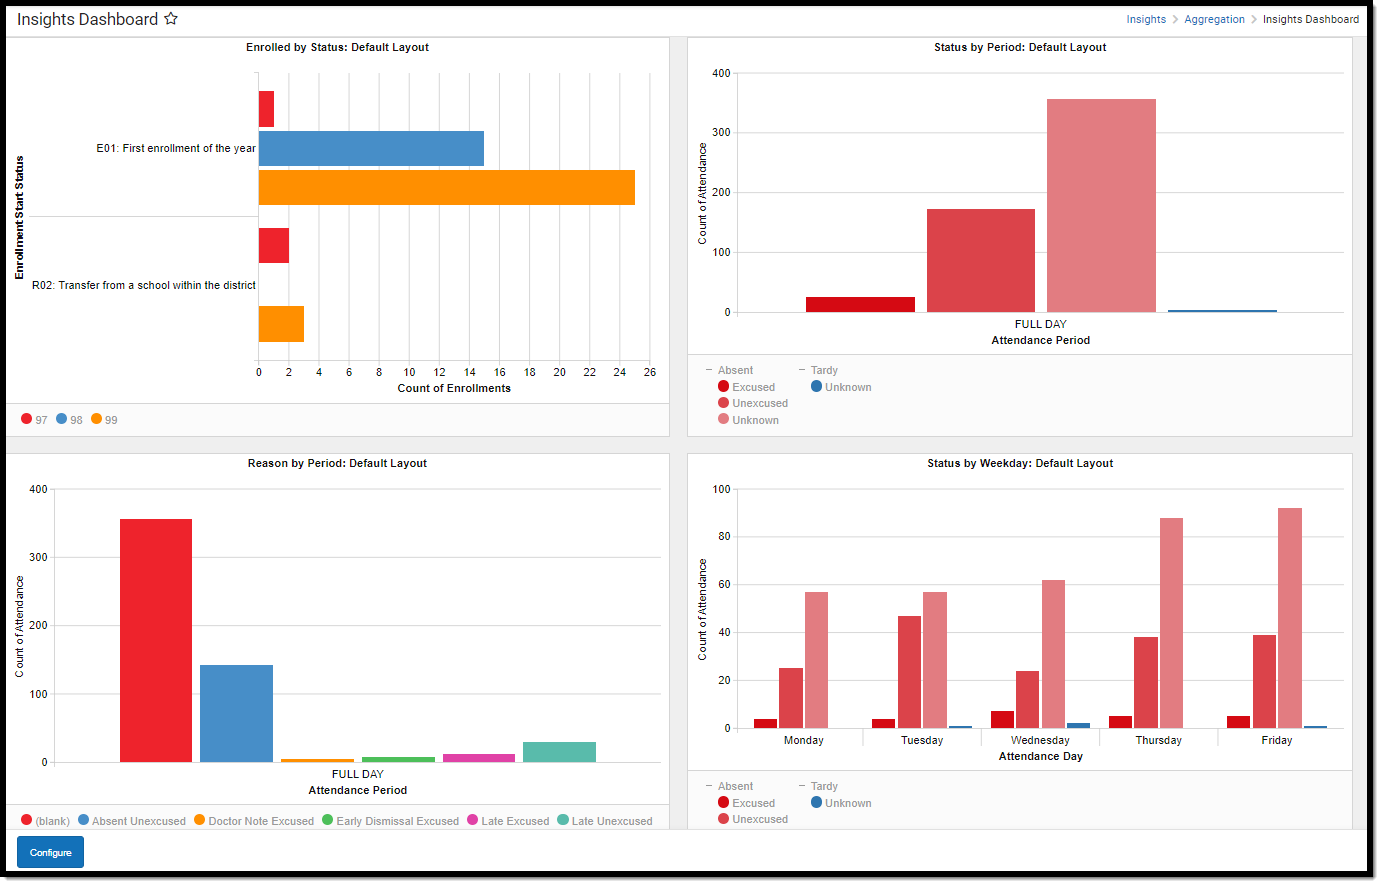
The Insights Dashboard allows you to quickly and easily view up to 4 Insights visualizations at the same time and customize data reported in each visualization using user-created templates.
This tool is only available for users in districts who have purchased the Campus Analytics Suite.
You must have at least R(ead) tool rights for the Insights Dashboard and any Insights visualizations selected in order to view them in the tool. You must also have calendar rights assigned for any calendar(s) reporting data.
NOTE: Insights visualizations may contain PII and include data for tools a user may not have rights to access.
Configure the Dashboard
The Insights Dashboard allows you to select any four Insights visualizations to automatically display each time you visit the dashboard. You can customize which visualization displays in which area of the dashboard and have each visualization's data automatically filter based on selected templates. You can also have the same report display multiple times utilizing different templates.
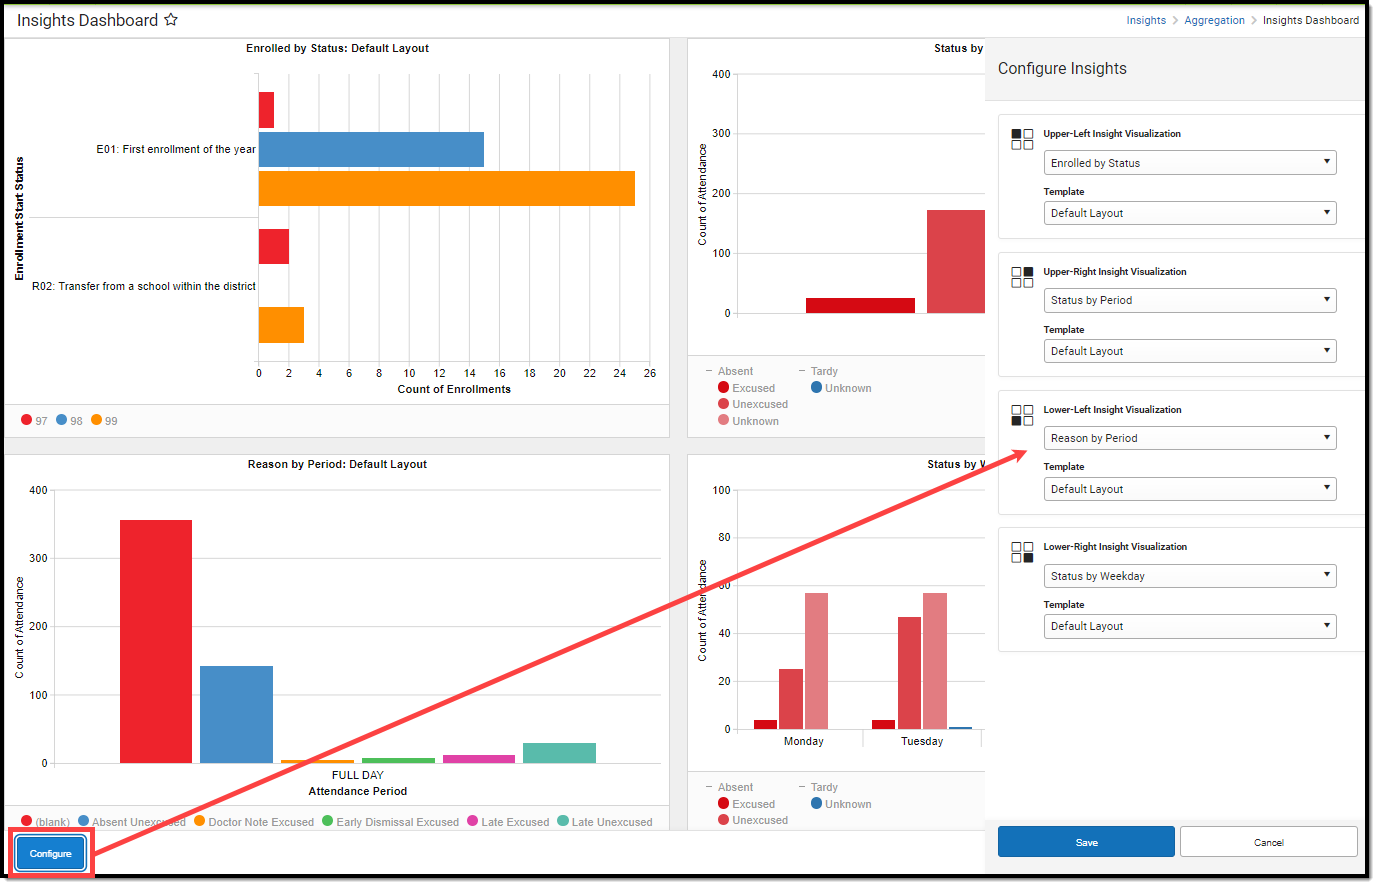
To configure the dashboard, select the Configure button in the bottom left-hand corner. A Configure Insights panel will appear on the right side of the screen (see image below).
| Configure Chart and Location | Select a Template | |
|---|---|---|
| Each section of the dashboard can be configured to display a specific Insights visualization. You can also select the same visualization multiple times in instances where different templates would be applied to view different outcomes. 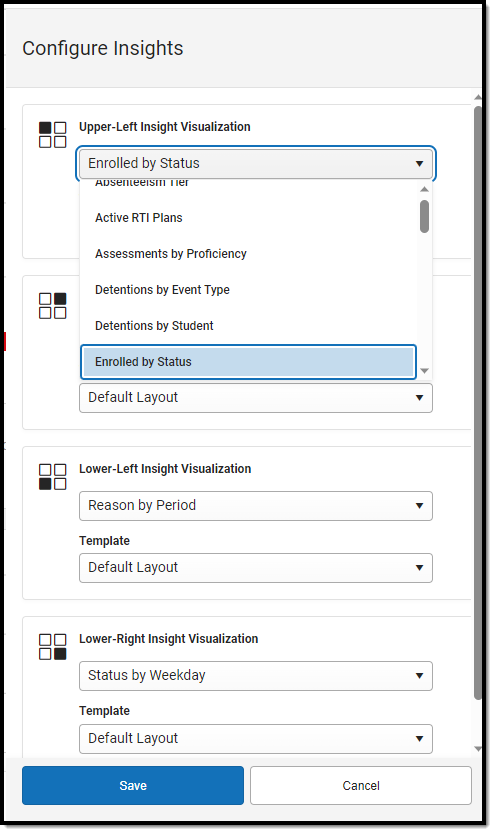 | Each visualization has a default layout however templates can be applied to any visualization selected. Templates automatically modify the reported data to match the filter and visualization options selected and saved for each template. Note: Templates are created separately for each visualization in their respective tools. See this section for details on how a template is created and saved for a visualization. 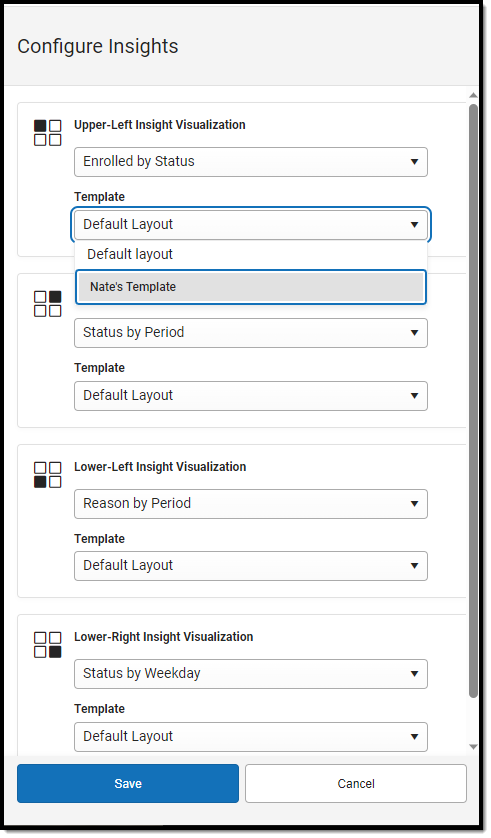 |
