Tool Search:ADM ad ADA Detail Report
The ADM and ADA Detail Report allows districts to generate aggregate attendance numbers for any set or subset of students within their district at any time. This report assists users in verifying information before submitting SAAR report data to the state.
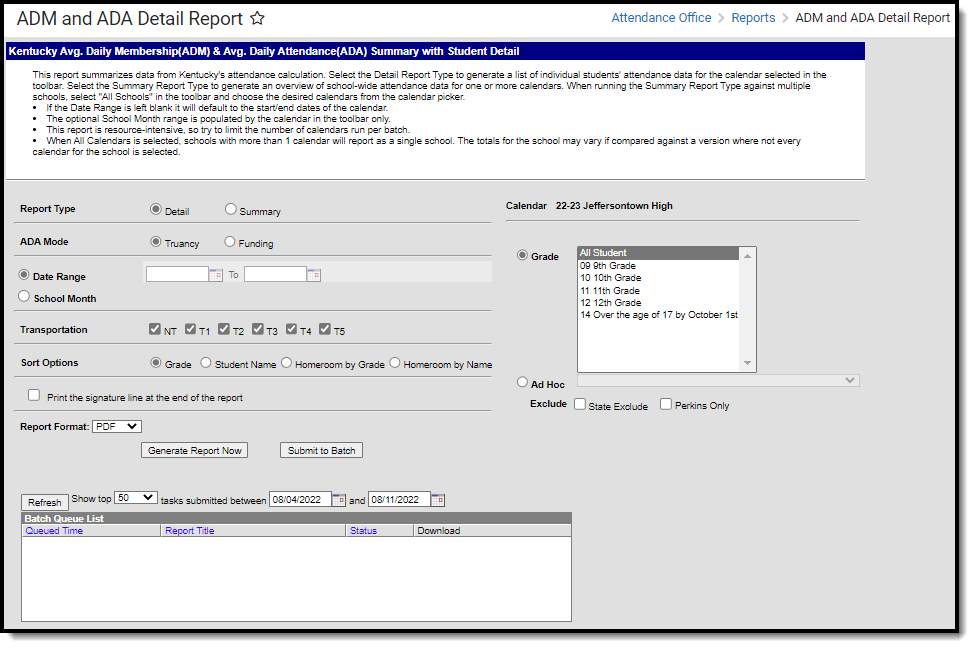
ADM and ADA Detail Editor
Report Selection Criteria
Attendance is excluded from the report under the following circumstances:
ADA/ADM Funding
- Day is not marked for both Instruction and Attendance.
- Under Age Grade 00: Grade 00 students who have not reached age 5 on or before August 1 of the reporting year. All attendance is excluded from the funding calculation.
- Under Age Grade 01: Grade 01 students who have not reached age 6 on or before August 1 of the reporting year. All attendance is excluded from the funding calculation.
- Over Age: All attendance which takes place on or after the student's 21st birthday is excluded.
- The Underage Waiver checkbox (Student Information > General > Enrollments > State Reporting Fields > Underage Waiver) overrides the exclusion from funding calculations.
- Attendance for Perkins Only students is excluded.
- Attendance for students whose enrollments are marked "State Exclude" is excluded.
- ADA/ADM Funding does not include any Virtual/Performance Based attendance.
- ADA/ADM Funding does not include any out-of-district transferred attendance.
ADA/ADM Truancy:
- Day is not marked for both Instruction and Attendance.
- ADA/ADM Truancy pulls all attendance for enrolled students regardless of age, Perkins or State Exclude status but will show 0 attendance for any student who is not enrolled in classed marked as Attendance.
- ADA/ADM Truancy does not include any Virtual/Performance Based attendance.
- ADA/ADM Truancy does not include any out-of-district transferred attendance.
Generate ADM/ADA Detail Report
- Select a Report Type.
- Select an ADA Mode. This determines whether funding or truancy calculations are emphasized on the report.
- Select a Date Range or School Month. Only data within this time frame is included in the report.
- Select any Transportation codes to report corresponding attendance data.
- Select which Calendar(s) will report data (Summary Report Type only).
- Select which Grade(s) will report data.
- Select an Ad Hoc filter (if Grade is not selected).
- Mark the State Exclude checkbox to exclude student data for students marked State Exclude.
- Mark the Perkins Only checkbox to exclude student data for students marked Perkins Only.
- Select a Sort Option.
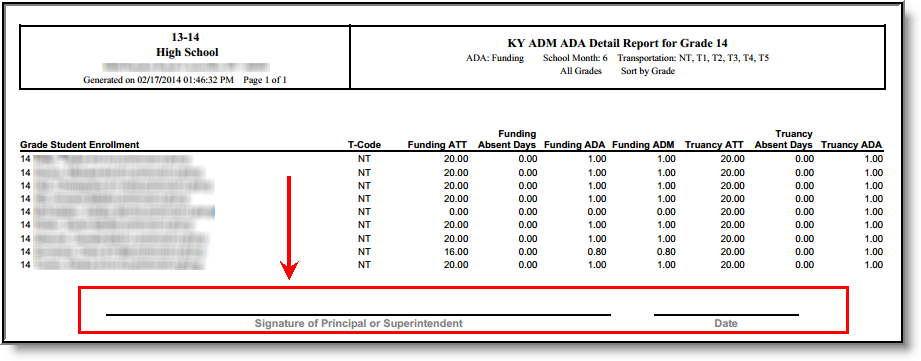
- Mark the Print the signature line at the end of the report checkbox if you would like a signature and date line to appear.
- Select the desired Report Format.
- Click the Generate Report Now button to view the report immediately or click the Submit to Batch button to send the report to a batch process. This is especially useful when generating the report for a large amount of data.
| Field | Description | ||
|---|---|---|---|
| Report Type | Detail - The detail report includes ADA/ADM information per student as well as summary data for grade level and transportation code. See here for more information. Summary - The summary report details ADA/ADM information for each grade level and transportation code. See here for more information. | ||
| ADA Mode | Truancy - The Truancy layout emphasizes truancy calculation fields and includes State Code information. Truancy mode produces calculations centered around the concept of “scheduled minutes” and student attendance is compared to the student’s individual scheduled time, as opposed to a fixed Standard Day. Funding - The Funding layout emphasizes funding calculation information. | ||
| Date Range | Information between this date range is used for reporting. | ||
| School Month | Information within the specified school month is used for reporting. School months are determined in the School Months tool. School months are named and sorted by sequence number. | ||
| Transportation | Only information tied to each selected transportation code selected is reported in certain sections of the report. | ||
| Sort Options | Grade - Data is sorted by grade level. Student Name - Data is sorted by student name. Homeroom by Grade - Data is sorted by student grade and homerooms. Homeroom by Name - Data is sorted by student homerooms. When sorting by Homeroom by Grade or Homeroom by Name, an attendance summary by homeroom is displayed. | ||
| Print the signatures line at the end of the report | If marked, a signature line and date line will be generated under each grade level reported and at the end of the report. See the image below for an example:
| ||
| Report Format | Determines how the report generates - PDF or DOCX. | ||
| Calendar(s) | If Detail Report Type is selected - The calendar for the currently selected school in the Campus toolbar is used. If Summary Report Type is selected - Users can select which calendar(s) to report data. | ||
| Grade | The grade(s) levels used for reporting data. | ||
| Ad Hoc | Instead of reporting student data based on grades, users can report data for a specific set of users defined within an Ad hoc filter. | ||
| Exclude | State Exclude - When marked, attendance data for students marked State Exclude is excluded from report data. Perkins Only - When marked, attendance data for students marked Perkins Only is excluded from report data. |
ADM/ADA Report, DOCX Format - Detail, All Transportation Codes, Sort by Grade
Understanding the ADM/ADA Detail Report
The ADA/ADM Detail is reported in 4 separate sets of data based on report options selected. The following sections describe each option:
ADM/ADA Detail - Truancy
The ADA/ADA Detail Truancy report defines truancy-related attendance data per student.
ADM/ADA Detail Report - Truancy
The table below describes each report column.
| Column | Description |
|---|---|
| Grade/Student/Enrollment | This column indicates the grade level, name and enrollment date of the student reporting ADA/ADM data. |
| T-Code | The transportation code of the student reporting data. |
| ATT | The sum of truancy WDHD present. For example, if a student was present for 2 days and absent for 1, the ATT would be 2. |
| ADA | The student's average daily attendance. ADA = (SUM of daily values for truancyWDHDpresent) / Instructional Attendance Days Truancy calculation only includes Instructional Attendance Days on which a student was scheduled . This value cannot exceed 1.0 for a single student in either truancy or funding mode for any time period. |
| ADM | The student's average daily membership. ADM = Days Enrolled / Instructional Attendance Days On a given day, the ADM represents 1 if the student is enrolled, 0 if they are not. A student who is enrolled but not scheduled on a given day is still given a value of 1. |
| Tardy - E | The number of excused tardies the student had during the reporting month or time period. |
| Tardy - U | The number of unexcused tardies the student had during the reporting month or time period. |
| Attendance State Code - E | WDHD value of absent days in which the final code is mapped to the State code of E. |
| Attendance State Code - U | WDHD value of absent days in which the final code is mapped to the State code of U. |
| Attendance State Code - AFD/R | The total FTE value of all events mapped to the state codes of AFD and AFR. Student cannot exceed 10.00 AFR per school year or 2.00 AFD per school year. Validation enforced on the Attendance tool. |
| Attendance State Code - EHO | The total FTE value of all events mapped to the state code of EHO. Student cannot exceed 10.00 EHO per school year. Validation is enforced on Attendance tool. |
| Attendance State Code - BT | The total FTE value of all events mapped to the state code of BT. Students cannot exceed 10.00 BT per school year. Validation is enforced on the Attendance tool. |
| Attendance State Code - ATA | The total FTE value of all events mapped to the state code of ATA. Student cannot exceed 2.00 ATA per school year. Validation is enforced on the Attendance tool. |
| Attendance State Code - EDN | WDHD value of absent days in which the final code is mapped to the State code of EDN. |
| Attendance State Code - EPN | WDHD value of absent days in which the final code is mapped to the State code of EPN. |
| Attendance State Code - S | The total FTE value of all events mapped to state code of S. |
| Attendance State Code - O | The total FTE value of all events mapped to state code of O. Attendance Codes in this category are typically exempt. Field trips often fall in this category. The ADA/ADM report shows HH attendances events in the O (Other) column. These days do not subtract from the ADA for the student as they are mapped to Present: Exempt. |
| Funding ADA | Funding ADA = (SUM of daily values for fundingWDHDpresent) / Instructional Attendance Days This calculation includes all Instructional Attendance Days, regardless of whether student is scheduled, as long as student is enrolled. |
ADM/ADA Detail - Funding
The ADA/ADA Detail Funding report defines funding-related attendance data per student.
ADM/ADA Detail Report - Funding
The table below describes each report column.
| Column | Description |
|---|---|
| Grade/Student/Enrollment | This column indicates the grade level, name and enrollment date of the student reporting ADA/ADM data. |
| T-Code | The transportation code of the student reporting data. |
| Funding ATT | The sum of funding WDHD present. For example, if a student was present for 2 days and absent for 1, the ATT would be 2. |
| Funding Absent Days | The sum of non-exempt attendance events with an excuse code of “Absent,” subject to Dual Enrollment Cap and Cap on Overscheduled Students. Funding absences are determined by the formula (possibleADA – truancyWDHDpresent). The result of this formula for each day is summed for the time period of the report |
| Funding ADA | Funding ADA = (SUM of daily values for fundingWDHDpresent) / Instructional Attendance Days This calculation includes all Instructional Attendance Days, regardless of whether student is scheduled, as long as student is enrolled. |
| Funding ADM | The student's average daily membership. ADM = Days Enrolled / Instructional Attendance Days On a given day, the ADM represents 1 if the student is enrolled, 0 if they are not. A student who is enrolled but not scheduled on a given day is still given a value of 1. |
| Truancy ATT | The sum of truancy WDHD present. For example, if a student was present for 2 days and absent for 1, the ATT would be 2. |
| Truancy Absent Days | The sum of non-exempt attendance events with an excuse code of “Absent”. Truancy absences are determined by the formula (1.0 – truancyWDHDpresent). The result of this formula for each day is summed for the time period of the report. |
| Truancy ADA | The average daily attendance. ADA = (SUM of daily values for truancyWDHDpresent) / Instructional Attendance Days Truancy calculation only includes Instructional Attendance Days on which a student was scheduled . This value cannot exceed 1.0 for a single student in either truancy or funding mode for any time period. |
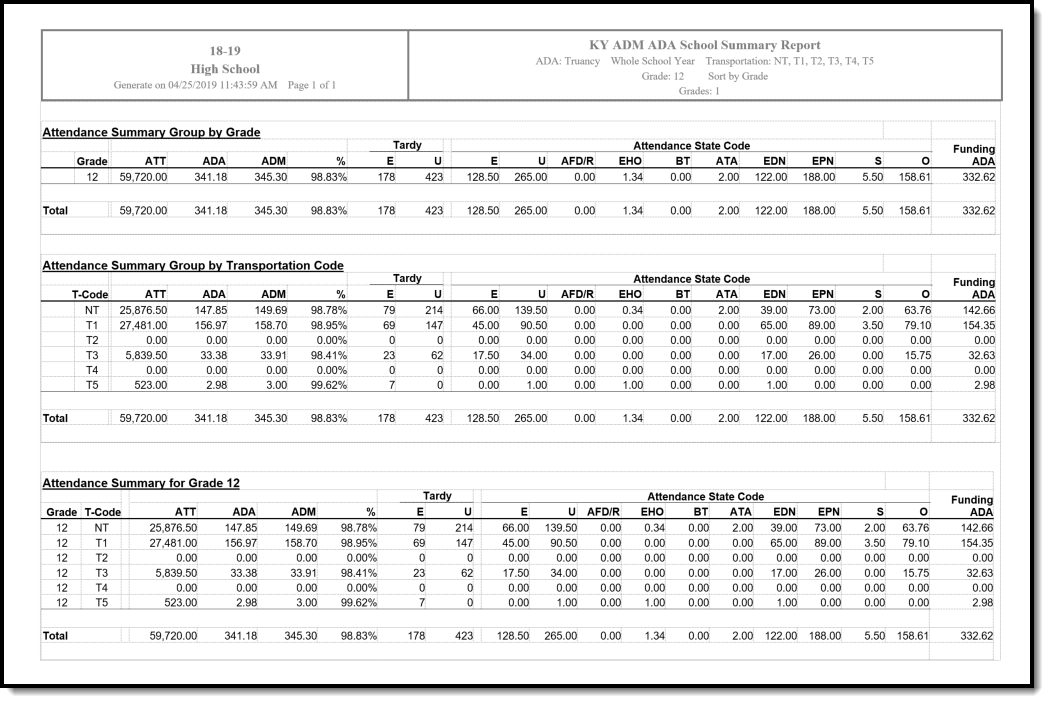
ADM/ADA Summary - Truancy
ADM/ADA Truancy Summary details truancy-related data per grade, transportation code and grade/transportation code combination.
ADM/ADA Summary - Truancy
The table below describes each report column.
| Column | Description |
|---|---|
| Grade | ADA/ADM truancy data reported per grade level (Attendance Summary Group by Grade and Attendance Summary sections). |
| T-Code | Indicates the transportation code tied to the grade level and ADA/ADM data being reported (Attendance Summary section). |
| ATT | The sum of truancy WDHD present. For example, if a student was present for 2 days and absent for 1, the ATT would be 2. |
| ADA | The average daily attendance. ADA = (SUM of daily values for truancyWDHDpresent) / Instructional Attendance Days Truancy calculation only includes Instructional Attendance Days on which a student was scheduled . This value cannot exceed 1.0 for a single student in either truancy or funding mode for any time period. |
| ADM | The average daily membership. ADM = Days Enrolled / Instructional Attendance Days On a given day, the ADM represents 1 if the student is enrolled, 0 if they are not. A student who is enrolled but not scheduled on a given day is still given a value of 1. |
| % | The percentage of attendance. This column calculates the percentage of the time period in which students attended school (ie, students attended school 90% of the time). % = Truancy ATT / (Truancy ATT + Truancy Absent Days) |
| Tardy - E | The number of excused tardies entered during the reporting school month or time period. |
| Tardy - U | The number of unexcused tardies entered during the reporting school month or time period. |
| Attendance State Code - E | WDHD value of absent days in which the final code is mapped to the State code of E. |
| Attendance State Code - U | WDHD value of absent days in which the final code is mapped to the State code of U. |
| Attendance State Code - AFD/R | The total FTE value of all events mapped to the state codes of AFD and AFR. Student cannot exceed 10.00 AFR per school year or 2.00 AFD per school year. Validation is enforced on the Attendance tool. |
| Attendance State Code - EHO | The total FTE value of all events mapped to the state code of EHO. Student cannot exceed 10.00 EHO per school year. Validation is enforced on Attendance tool. |
| Attendance State Code - BT | The total FTE value of all events mapped to the state code of BT. Students cannot exceed 10.00 BT per school year. Validation is enforced on the Attendance tool. |
| Attendance State Code - ATA | The total FTE value of all events mapped to the state code of ATA. Student cannot exceed 2.00 ATA per school year. Validation is enforced on the Attendance tool. |
| Attendance State Code - EDN | WDHD value of absent days in which the final code is mapped to the State code of EDN. |
| Attendance State Code - EPN | WDHD value of absent days in which the final code is mapped to the State code of EPN. |
| Attendance State Code - S | The total FTE value of all events mapped to state code of S. |
| Attendance State Code - O | The total FTE value of all events mapped to state code of O. Attendance Codes in this category are typically exempt. Field trips often fall in this category. The ADA/ADM report shows HH attendances events in the O (Other) column. These days do not subtract from the ADA for the student as they are mapped to Present: Exempt. |
| Funding ADA | Funding ADA = (SUM of daily values for fundingWDHDpresent) / Instructional Attendance Days This calculation includes all Instructional Attendance Days, regardless of whether student is scheduled, as long as student is enrolled. |
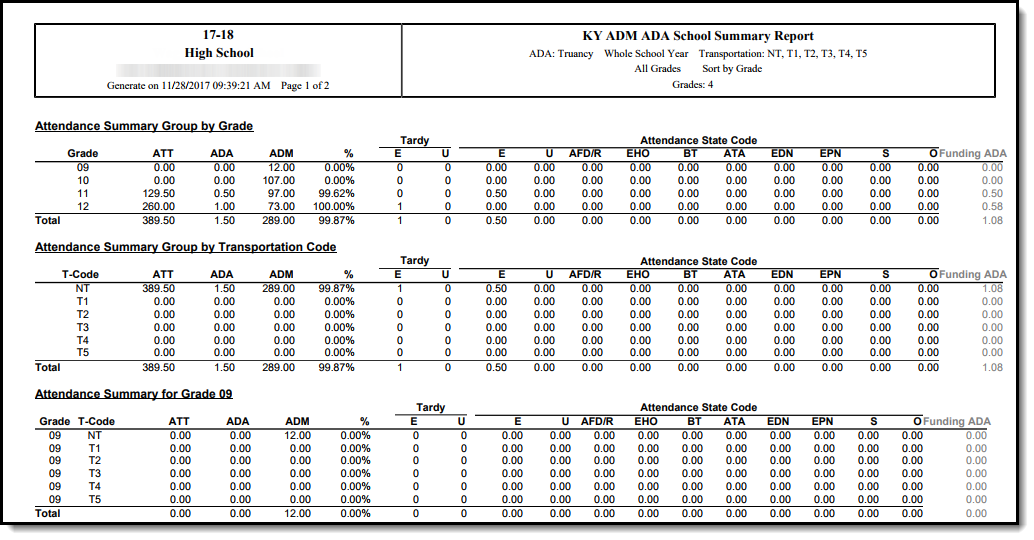
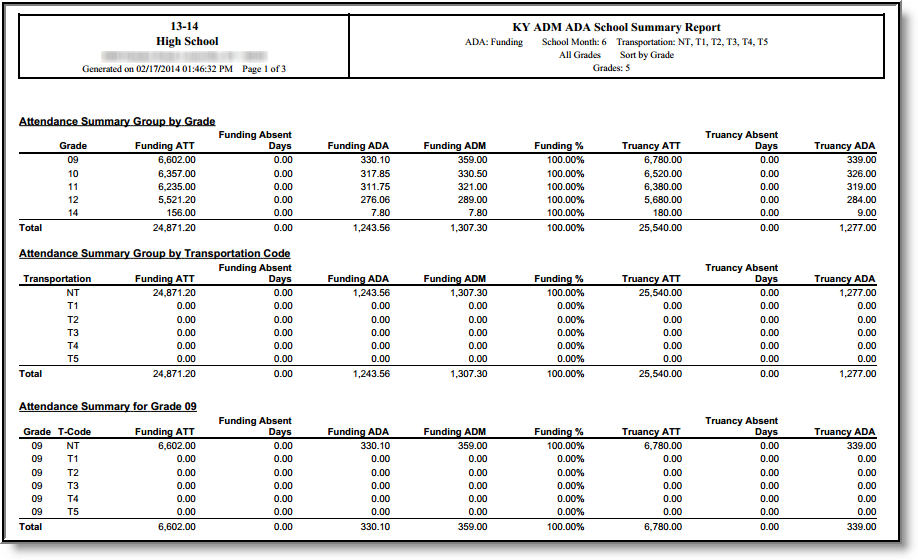
ADM/ADA Summary - Funding
ADM/ADA Funding Summary details funding-related data per grade, transportation code and grade/transportation code combination.
.
ADM/ADA Summary - Funding
The table below describes each report column.
| Column | Description |
|---|---|
| Grade | ADA/ADM funding data reported per grade level (Attendance Summary Group by Grade and Attendance Summary sections). |
| Transportation | ADA/ADM funding data reported per transportation code (Attendance Summary Group by Transportation Code and Attendance Summary sections). |
| T-Code | Indicates the transportation code tied to the grade level and ADA/ADM data being reported (Attendance Summary section). |
| Funding ATT | The sum of funding WDHD present. For example, if a student was present for 2 days and absent for 1, the ATT would be 2. |
| Funding Absent Days | The sum of non-exempt attendance events with an excuse code of “Absent,” subject to Dual Enrollment Cap and Cap on Overscheduled Students. Funding absences are determined by the formula (possibleADA – truancyWDHDpresent). The result of this formula for each day is summed for the time period of the report |
| Funding ADA | The average daily attendance. ADA = (SUM of daily values for fundingWDHDpresent) / Instructional Attendance Days Funding calculation includes all Instructional Attendance Days, regardless of whether student is scheduled, as long as student is enrolled. |
| Funding ADM | The average daily membership. ADM = Days Enrolled / Instructional Attendance Days On a given day, the ADM represents 1 if the student is enrolled, 0 if they are not. A student who is enrolled but not scheduled on a given day is still given a value of 1. |
| Funding % | The percentage of Attendance. This column calculates the percentage of the time period in which students attended school (ie, students attended school 90% of the time). Funding % = Funding ATT / (Funding ATT + Funding Absent Days) This calculation is designed not to depress the % of attendance due to students who are not scheduled but who are still enrolled, such as students enrolled in speech therapy who are not scheduled, or V/P-only students, or students who attend 1 day of a 2 day rotation. |
| Truancy ATT | The sum of truancy WDHD present. For example, if a student was present for 2 days and absent for 1, the ATT would be 2. |
| Truancy Absent Days | The sum of non-exempt attendance events with an excuse code of “Absent”. Truancy absences are determined by the formula (1.0 – truancyWDHDpresent). The result of this formula for each day is summed for the time period of the report. |
| Truancy ADA | The average daily attendance. ADA = (SUM of daily values for truancyWDHDpresent) / Instructional Attendance Days Truancy calculation only includes Instructional Attendance Days on which a student was scheduled. This value cannot exceed 1.0 for a single student in either truancy or funding mode for any time period. |
