Tool Search: Graduation Rate
This report is only available in State Edition and state-linked District Edition sites.
The Graduation Report extracts and calculates graduation rates for a cohort of students. Several Reports are available:
- Cohort Detail Report
- Cohort Summary Report
- Extended Year Cohort Report
- Interactive Cohort Report
- Single Year Detail Report
- Single Year Summary Report
These reports are for a specific cohort, which generally means the students are all in one grade. The Cohort Detail and Cohort Summary reports show data from grades 9-12 for the students in the cohort with their status in a particular grade (a student in the 2018 cohort transferred into the school in Grade 10 and dropped out in Grade 11, for example).
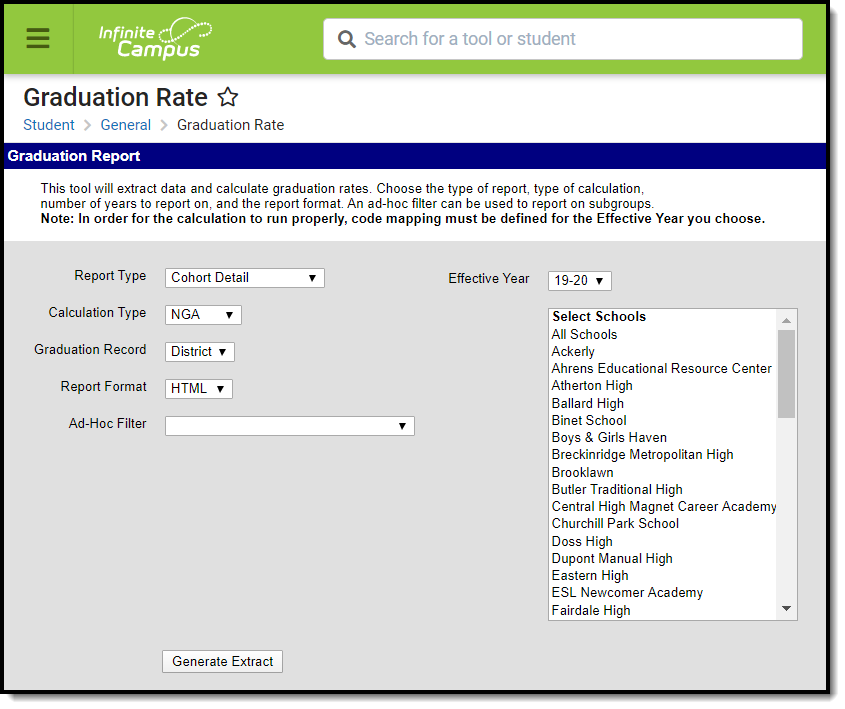 Graduation Rate Editor
See the Student Information Reports Tool Rights article for the tool rights needed to generate this report.
Report Logic
In order to properly calculate graduation rates, the Start Status, End Status and Diploma Types MUST be defined on a yearly basis using the Code Defining tool. This step must be completed by a State Edition user. Data is then pushed to the state-linked district editions for these items.
The following is assigned to enrollments based on the mapped value:
| Mapped Value | Description | Logic |
|---|---|---|
| TIN | This value is assigned to enrollments with a start status mapped to a value of Transferred In. | A student is considered transferred in if there is an enrollment with a start status mapped to TIN or if there is no enrollment for the previous school year. |
| TOT | This value is assigned to enrollments with an end status mapped to a value of Transferred Out. | A student is considered transferred out if they have an enrollment with an end status mapped to TOT or if the student has enrollments with at least one year gap between them.
|
| DRP | This value is assigned to enrollments with an end status mapped to a value of Dropped Out. | A student is considered dropped out if they have an enrollment with an end status mapped to DRP or if the student leaves the school before year 4 with an enrollment end status mapped to something other than TOT or DED. |
| DED | This value is assigned to enrollments with an end status mapped to a value of Cohort Deduction. | A student is considered a deduction if they do not have a returning enrollment and the last enrollment for the student has an end status mapped to DED. If the student has an enrollment after this, they will not be considered as a DED. |
| GRD | This value is assigned to enrollments with an end status mapped to a value of Graduated or a valued is entered in the Diploma Type field. | If the calculation type is NGA or Single Year, a student is considered as Graduated if the Diploma Type is not NULL and there is a Diploma Date or Enrollment End Date, regardless of End Status. If the calculation type is USDOE, a student is only considered as Graduated if the Diploma Type is not NULL and there is a Diploma Date or Enrollment End Date, regardless of End Status. This calculation only counts students with a Diploma Type mapped to "Regular High School Diploma". |
Report Editor
| Data Elements | Description |
|---|---|
| Report Type | Indicates which graduation report generates. Options include:
|
| Calculation | Indicates which calculation type is applied to the report. Options include:
See the Graduation Rate Calculation Information section below for more information. |
| Graduation Record | Indicates which graduation record reports. The report can be generated on the State Graduation Record or the District Graduation Record. In order for the district to properly generate the state report, State Edition users must publish graduation records to all districts. |
| Report Format | Indicates the format in which to run the report. Options include:
|
| Ad hoc Filter | Lists previously created filters that can be used to create a subgroup of students to include in the report. |
| Effective Year | Indicates from which school year graduation data reports. |
| Select Schools | Displays a list of schools from which to report graduation data. Only schools within the selected effective year display, and only schools in which eleventh and twelfth grade levels exist are available for selection. |
Graduation Rate Calculation Information
The following information details the available report types.
| Calculation | Formula | Description |
|---|---|---|
| NGA 4-Year Adjusted Cohort Calculation | Graduation Rate = (Number of cohort members who graduated / ((Number in original cohort) + (Transfers in) - (Transfers out) - (Cohort deductions))) X 100 | This rate describes the number of students who have a NGA Cohort End Year that is Equal to the Effective Year entered on report editor. Four full years of data is needed to perform the calculation. The system gathers the following information to calculate the rate for a user specified year:
See the Cohort Detail Report Examples section for print examples. |
| USDOE 4-Year Adjusted Cohort Calculation | Graduation Rate = (Number of cohort members who graduated / ((Number in original cohort) + (Transfers in) - (Transfers out) - (Cohort deductions))) X 100 | This rate describes the number of students who started 9th grade in the same year that graduated four years later. Four full years of data is needed to perform the calculation. The information needed to calculate the rate is the same as the NGA information above except that the NCLB Cohort End Year field is used instead of NGA Cohort End Year and only regular diploma types are counted (other credentials do not count).
The formula for the USDOE calculation is the same as the calculation for the NGA rate above. |
| Extended Year Adjusted Cohort Calculation | Graduation Rate = (Number of cohort members who graduated / ((Number in original cohort) + (Transfers in) - (Transfers out) - (Cohort deductions))) X 100 | This rate describes the number of students who started 9th grade in the same year that graduated 5 or 6 years later. Five full years of data is needed to calculate the 5 year rate; six full years of data is needed to calculate the 6 year rate. The information needed to calculate the extended NGA rate is the same as the NGA information above except it expands the scope of each item to include the 5th and/or 6th year. The information needed to calculate the extended USDOE rate is the same as the USDOE information above except it expands the scope of each item to include the 5th and/or 6th year. See the Extended Year Cohort Report Examples section for print examples. |
| Single Year Calculation | Graduation Rate = (Number of students in 12th grade who graduated / number of students in 12th grade) X 100 | This rate describes the number of students in 11th and 12th grades who graduate in a specified year. As this rate depends on students having graduated, the rate is only useful on data at the end of the current year or on data from previous years. The system gathers the following information to calculate the rate:
See the Single Year Detail Report Examples and Single Year Summary Report Examples sections for print examples. |
When State Edition users generate the Cohort Summary report using the USDOE calculation using the State Graduation record, the results of the report are saved to the GraduationRateReportResults tool. States can then create a Data Validation that can be used to allow Districts to certify on their graduation rate. This report will save 1 record per District and Cohort Year. Each time the report is run with the above parameters, the record is updated in the table. The districts can also run the report to update the table on the DE and then run the Data Validation tool on their District Data.
Generate the Graduation Rate Report
- Choose a Report Type from the dropdown list.
- Select a Calculation type from the dropdown list.
- Select the Graduation Record type from the dropdown list.
- Select a Report Format. Format options are limited by the Report Type selected.
- Choose an Ad Hoc Filter, if desired.
- Select an Effective Year from the dropdown list.
- Choose one or multiple schools from the Select Schools area.
- Click Generate Extract. Results appear in a new window in the selected format.
Cohort Detail Report Examples
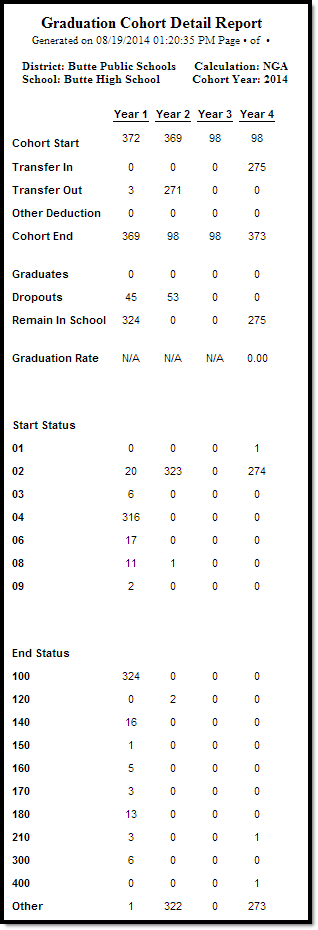 Graduation Cohort Detail - HTML, Page 1
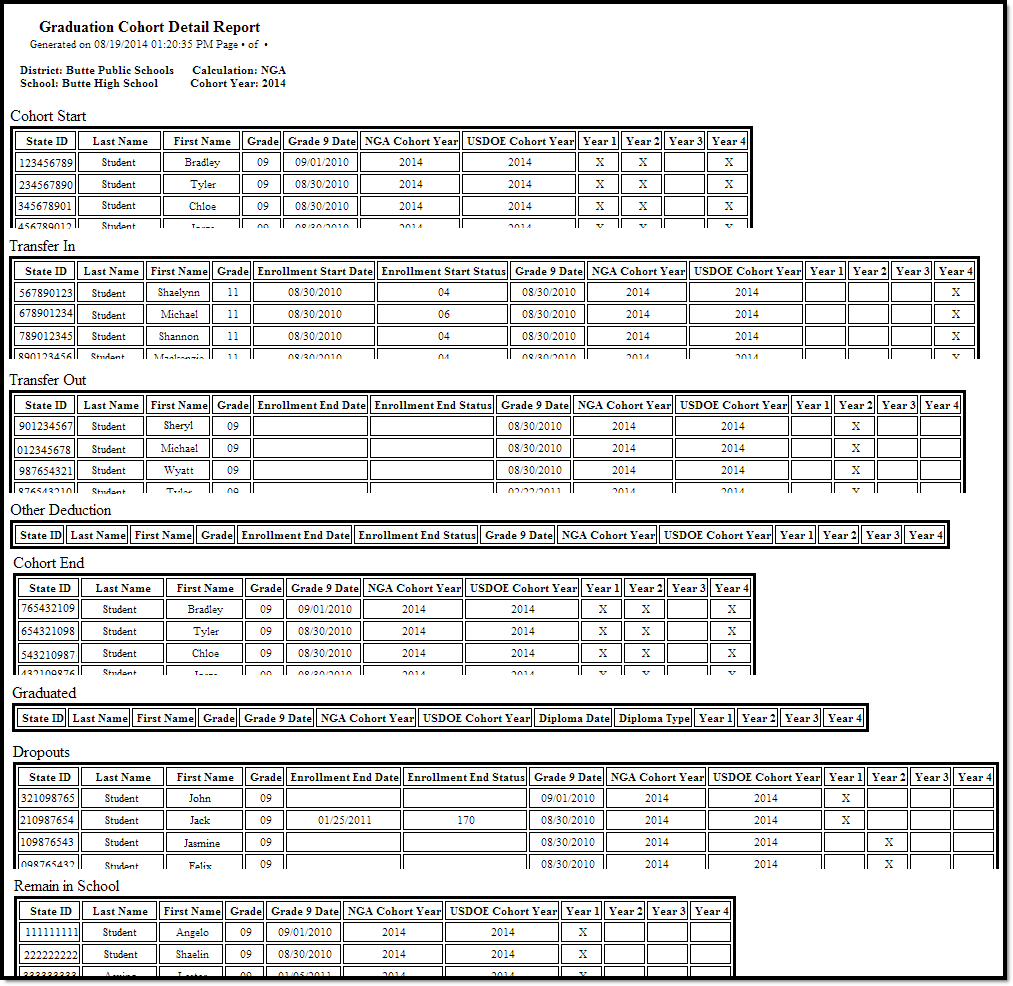 Graduation Cohort Detail - HTML, Page 2
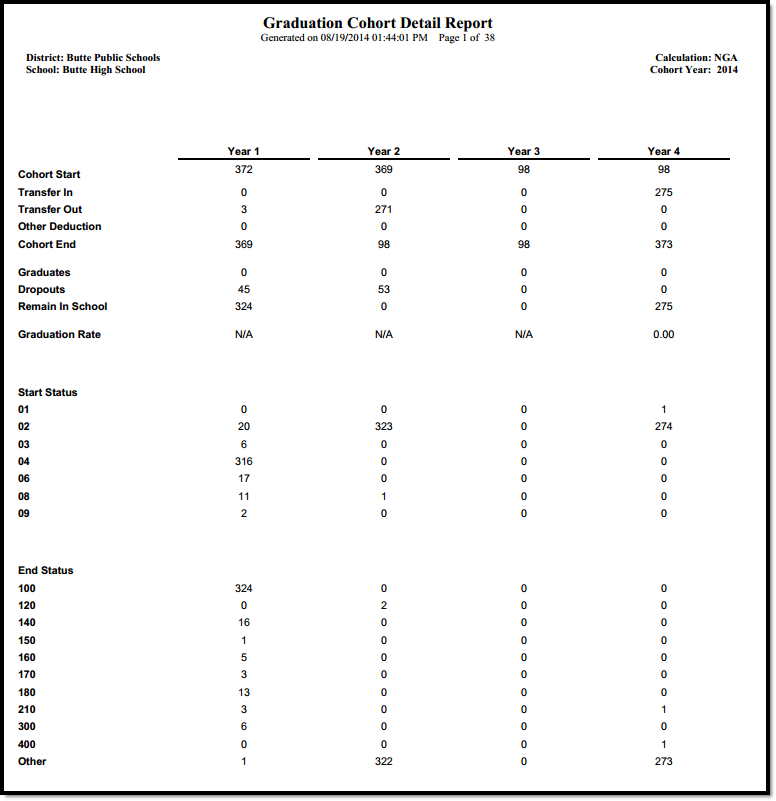 Graduation Cohort Detail - PDF, Page 1
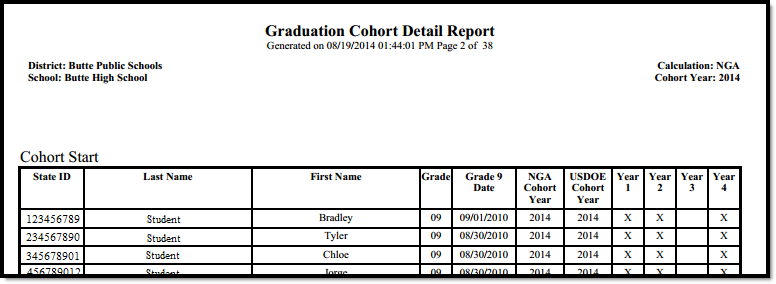 Graduation Cohort Detail - PDF, Page 2
Extended Year Cohort Report Examples
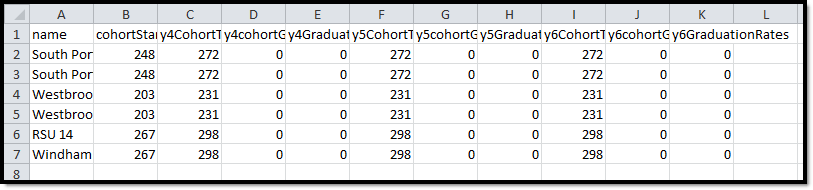 Extended Year Cohort - CSV
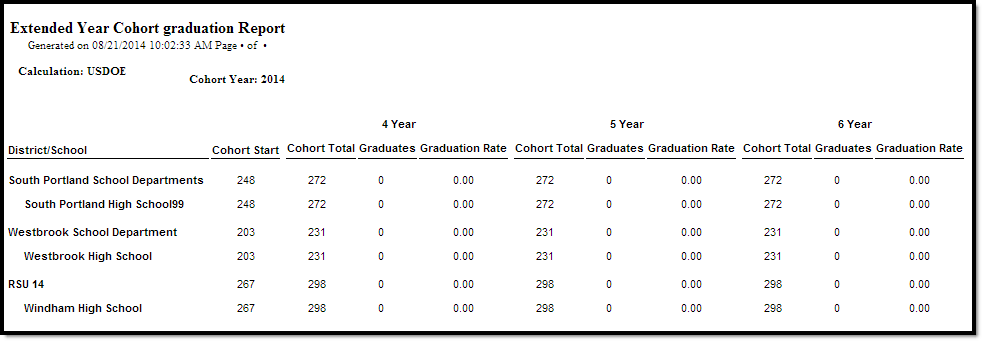 Extended Year Cohort - HTML
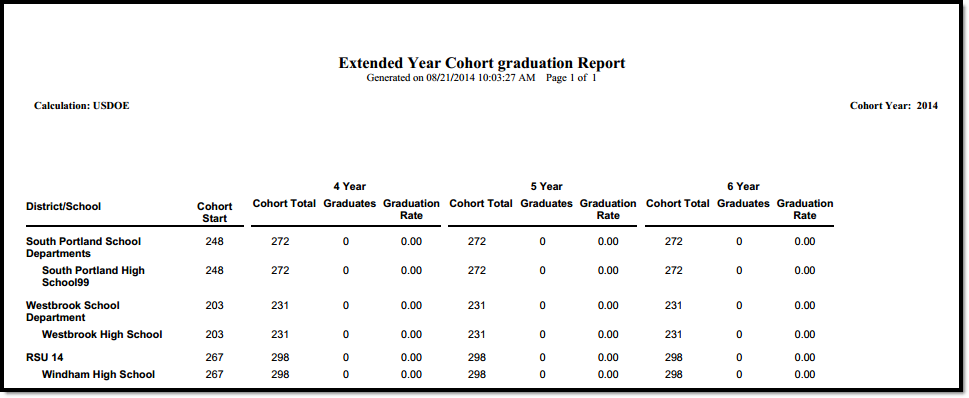 Extended Year Cohort - PDF
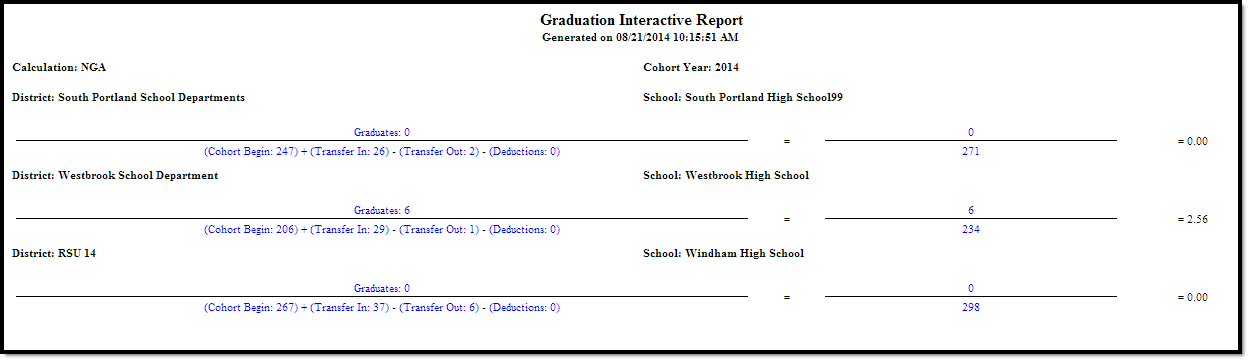
Interactive Cohort
This report provides an in depth view of how graduation rates are calculated. Clicking on the blue figures displays where the figure is coming from in Campus. This report is only available in HTML format.
 Interactive Cohort Example
Single Year Detail Report Examples
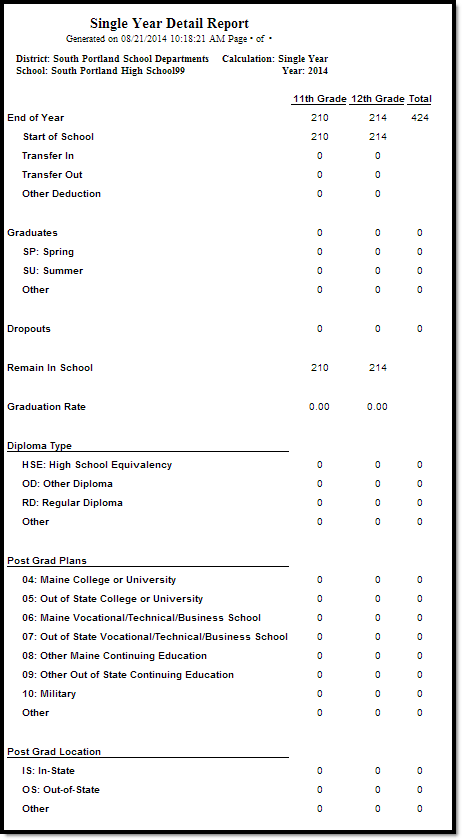 Single Year Detail - HTML, Page 1
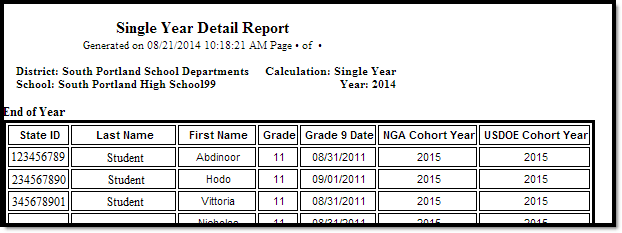 Single Year Detail - HTML, Page 2
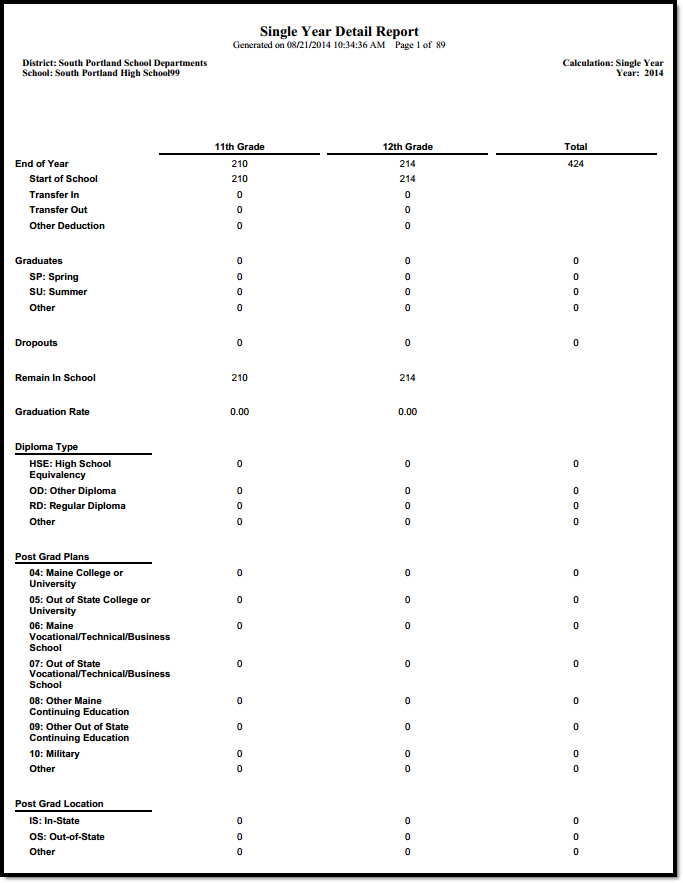 Single Year Detail - PDF, Page 1
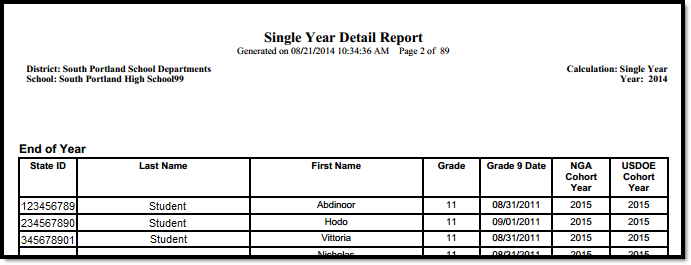 Single Year Detail - PDF, Page 2
Single Year Summary Report Examples
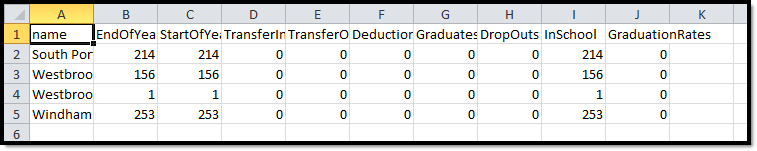 Single Year Summary - CSV
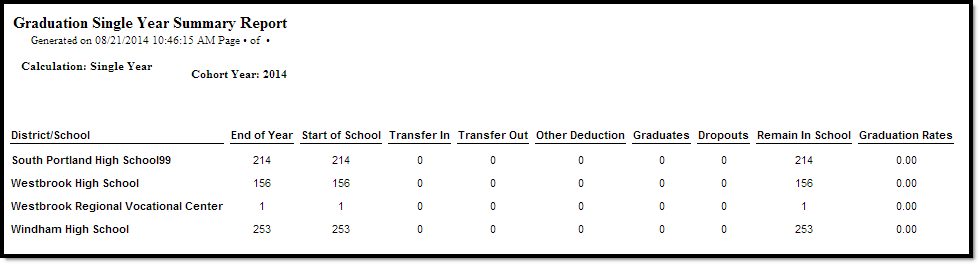 Single Year Summary - HTML
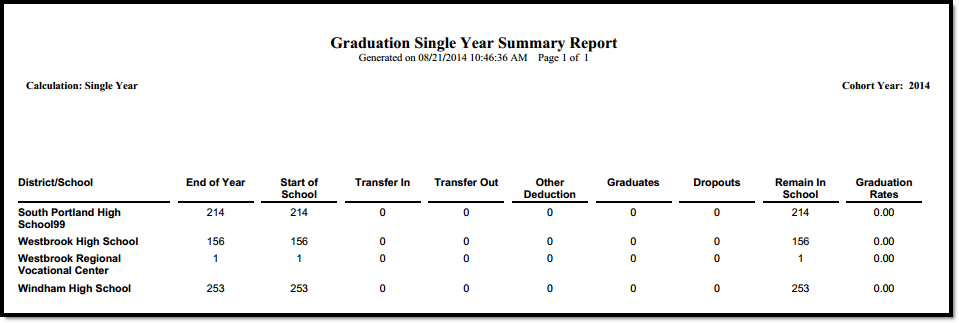 Single Year Summary - PDF
