Tool Search: CSR J-7
The J-7 CSR Enrollment Extract lists class size averages, sorted by grade level and average enrollment for the year. Growth classes, which begin after the first day of school, report separately from regular classes. Students must be enrolled in a course section on April 15 or the last Instructional Day before April 15 for the courses to report.
The J-7 CSR Report can be generated two ways:
Batch queue functionality is available with this report. Instead of generating the report immediately, a larger selection of data can be chosen and set to generate at a specific time (after school hours, for example). See the Batch Queue (Admin) article for more information on this process.
 CSR J-7 Enrollment Report
Read - Access and generate the CSR J-7 Enrollment Report
Write - N/A
Add - N/A
Delete - N/A
For more information about Tool Rights and how they function, see the Tool Rights article.
Evaluation Report Type
Report Logic
The following courses report:
- Course Sections where students in grades KN-03 (state grade level) are enrolled are used in the calculation of class size averages.
- Course Sections where students in grade KN-03 AND other grade levels are also included.
- If the Course Section has no active students on April 15 or the last instructional day prior to April 15 (if that date is not an instructional day), the course does not report.
Students who have an active Independent Student Program (state code = 111 or 170) are not included in the student count of the course section or in the class size average on the days the Program is active.
Averages are calculated to two decimal places. The averaging period is from the first Instructional Day of school until April 15 (or the last instructional day before April 15).
The report is grouped and ordered first by grade level, as such: KN, 01, 02, 03, combination.
- All courses with multiple grade levels after the single grade level courses are sorted and counted by year average totals in the same manner.
- Within each grade level, records are grouped by Year Average (Rounded), sorted alphabetically by teacher last name.
Averaging data for Growth Classes, which start after the first day of school, are reported after the regular classes in a separate section. This information is printed on the Growth Courses Exception Report.
Report Editor
Field |
Description |
|---|---|
Report Type |
Two options are available - Evaluation or District-wide. The Evaluation report type is the default selection.
|
Grade Level |
If a grade level is marked, information about the students enrolled in that grade reports. Only calendars that include grade levels KN-03 report.
An alphanumeric grade level can be selected as well. Schools using ungraded levels can select UE or US as needed. |
Format |
The report generates in PDF format only. |
| Exclude Cross-Site Data | When marked, students enrolled in Cross-Site Enrollment courses are not included in the report. |
Course Sections |
A list of course sections to include is available. All sections may be selected or a series of sections can be selected. |
Generate the J-7 CSR Extract for the Evaluation Report Type
- Select the Report Type for the J-7 CSR as Evaluation.
- Select which Grade Levels to include on the report.
- Select the Format of the report.
- Mark the Exclude Cross-Site Data checkbox to remove students enrolled in Cross-Site courses from the report.
- Select the Course Sections to include on the report.
- Click the Generate Report button to display the results of the extract immediately. Or click the Submit to Batch button to choose when the report generates.
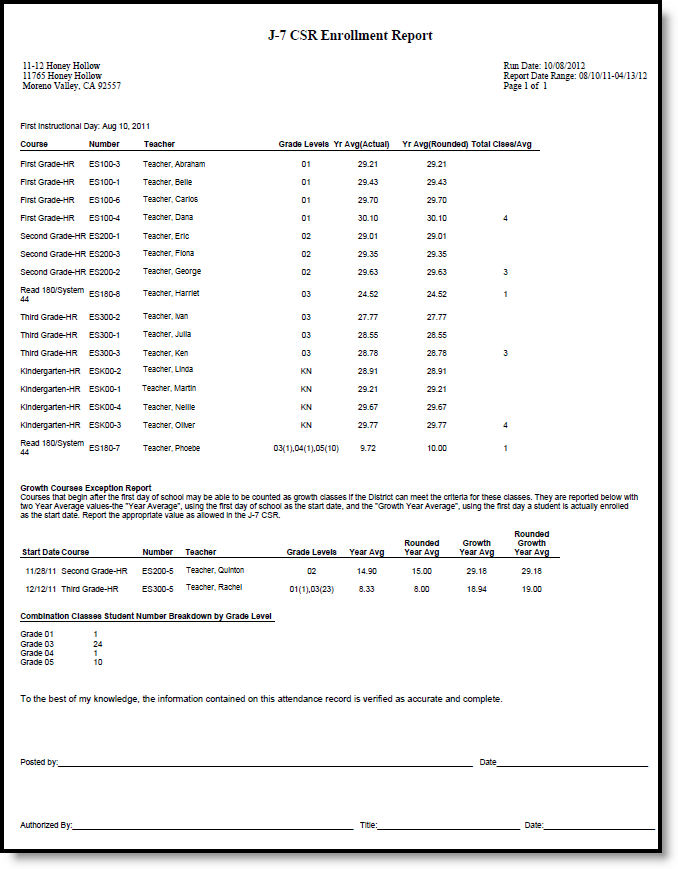 J-7 CSR Evaluation Report
Report Definitions
Field |
Description |
|---|---|
Course |
Name of the course. |
Number |
Number of the course and section number, reported as such:
|
Teacher |
Name of the primary teacher.
|
Grade Levels |
Reports the grade level(s) of the students scheduled into the course section. If a student changes grade levels but remains on the section roster, both grade levels report. |
Grade Level Breakdown |
Reports the number of students in each grade level if more than one grade level is represented in the selected course sections. This number represents the breakdown by grade as of the Reporting Date.
|
Year Average (Actual) |
Reports the average daily enrollment by summing the number of students on the roster for each instructional day divided by the total number of instructional days.
|
Year Average (Rounded) |
Reports the yearly average of enrollments in the course as followings:
|
Total Classes/
|
Reports the number of classes in a grade level that have the same Year Average (Rounded) value. For Year Average (Rounded) values from 20.45 and up count the number of classes with values in the following groups:
|
Start Date |
Reports the first instructional day a student is enrolled in the course, not including students in Program 111 or 170. |
Growth Year Average |
Reports the average daily enrollment by summing the number of students on the section roster for each instructional day and dividing by the total number of instructional days.
|
Growth Year Average (Rounded) |
Reports the actual growth year average rounded value up to 20.44. NN.44 rounds up, NN.45 rounds down. If the value is 20.45 or higher, the actual number (no rounding) reports. |
District-Wide Report Type
Report Logic
The following courses can report:
- All calendars with at least one grade level K-3 may be reported, except those marked as State Exempt.
- Course sections included for selection must have a State Code of 1000 and the Instructional Strategy cannot be 300 or 700.
- Course sections must be marked as Homeroom on either the Course or the Section. Or, if the Homeroom Only checkbox is not selected, courses and sections do not need to be marked as homeroom.
The following students report:
- All students in a selected course section including students marked as State Exclude must be included in the enrollment count UNLESS:
- The student has an active Program 111 or 170 (Independent Study). The student is not included in the enrollment count on all days in which the program is active.
- When the Exclude SDC students checkbox is marked, students with the Attendance Funding Category of 19: Special Day are not included in the enrollment count.
Report Editor
| Field | Description |
|---|---|
Report Type |
Two options are available - Evaluation or District-wide. The Evaluation report type is the default selection.
|
Grade Level |
If a grade level is selected, information about the students enrolled in that grade reports. Only calendars that include grade levels KN-03 report. |
Format |
The report generates in PDF format only. |
Homeroom Only |
When marked, the report only includes courses or sections that are considered to be homeroom courses. |
Exclude SDC Students |
When marked, students assigned the Attendance Funding Category of 19: Special Day are not reported. |
| Exclude Cross-Site Data | When marked, students enrolled in Cross-Site Enrollment courses are not included in the report. |
Course Sections |
A list of course sections to include is available. All sections may be selected or a series of sections can be selected. |
Generate the Report
- Select the Report Type for the J-7 CSR as District-wide.
- Select which Grade Levels to include on the report.
- Select the Format of the report.
- Mark the Homeroom Only if only those course sections should print.
- Mark the Exclude SDC students if those students should not be included on the report.
- Mark the Exclude Cross-Site Data checkbox to remove students enrolled in Cross-Site courses from the report.
- Select the Course Sections to include on the report.
- Click the Generate Report button to display the results of the extract immediately. Or click the Submit to Batch button to choose when the report generates.
When the Calendar, Homeroom Only and Exclude SDC Students fields are selected, the printed view indicates those selections.
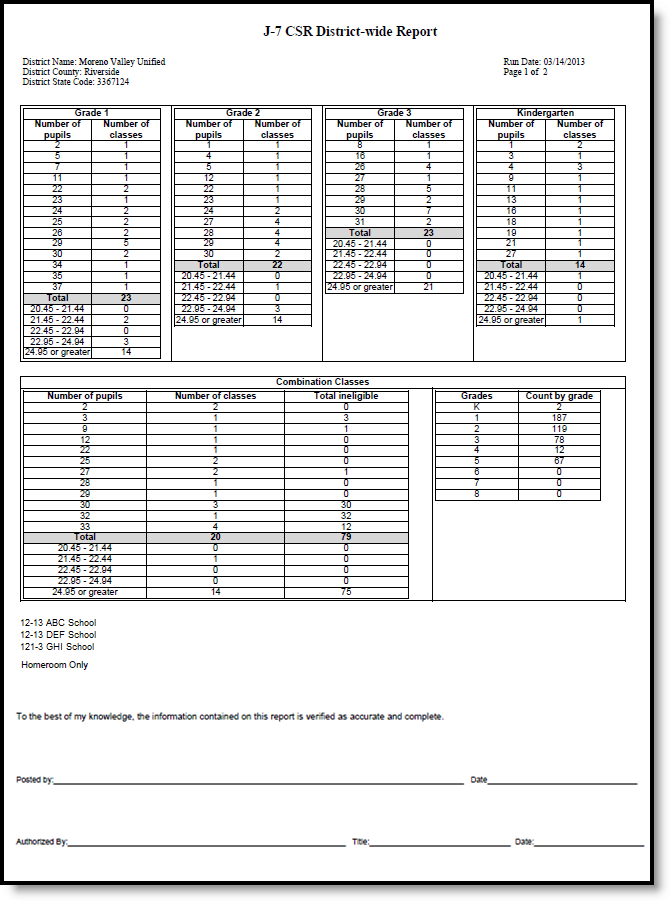 J-7 CSR District-Wide Report
Report Definitions
| Field | Description |
|---|---|
Number of Pupils-Whole Numbers |
Average number of students in a class for the Reporting Period. A row reports for each unique Average Number (whole number) calculated for the reported class. Average numbers of 20 or more are also reported in the section below the Total.
|
Number of Classes |
This is the total number of classes in a grade (1, 2, 3, KN or a combination of grades) with the same Average Number (number of pupils). If there are no classes in a particular grade for an Average Number, zero (0) reports. |
| Total | This row reports the total number of classes reported for each grade level using the whole number averages above. |
| Number of Pupils-breakdown for Average 20 or greater |
|
Total Ineligible |
This is a count of all students in a combination class who are not eligible to be included in CSR funding. If "All Grades" is selected on the extract editor, this is the total number of students in Grade 4 or above. If individual grade levels are selected on the extract editor, this is any student above the highest selected grade. |
Count by Grade |
Count of all students in a specific grade level in the combination classes as of April 15 or the last instructional day before April 15. |
