Tool Search: Seating Charts
Seating charts provide a visual representation of where students sit in a classroom. Each section can have multiple seating charts if desired.
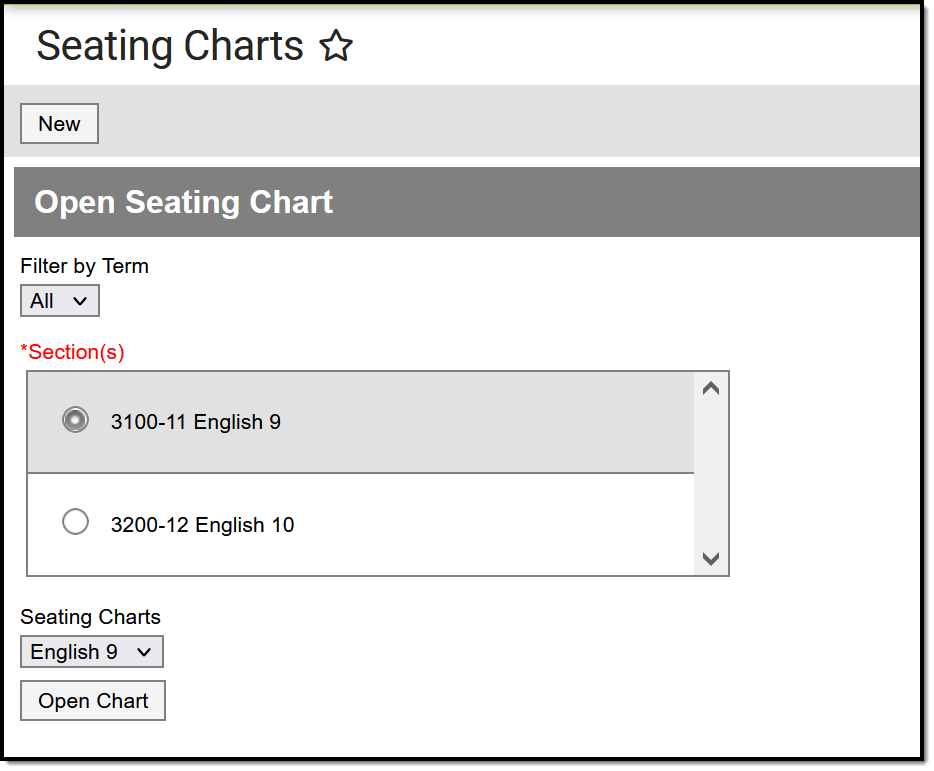
To view a chart, select a section and then a chart from the dropdown list and click Open Chart
See the Instruction Tool Rights article for information on available tool rights.
Using Seating Charts
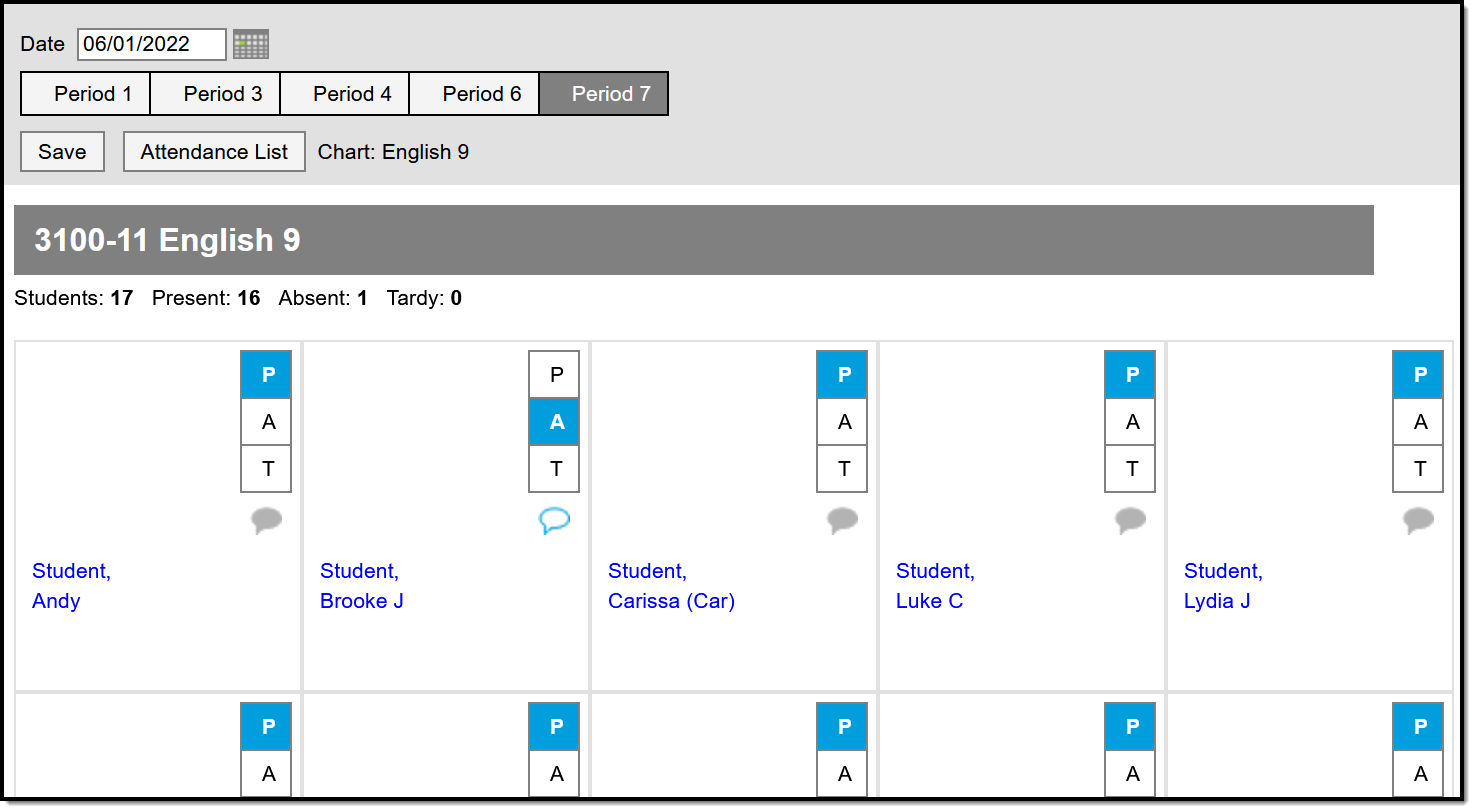
In addition to being a record of where students sit, use seating charts to take attendance.
Taking Attendance Using a Seating Chart
Creating Seating Charts
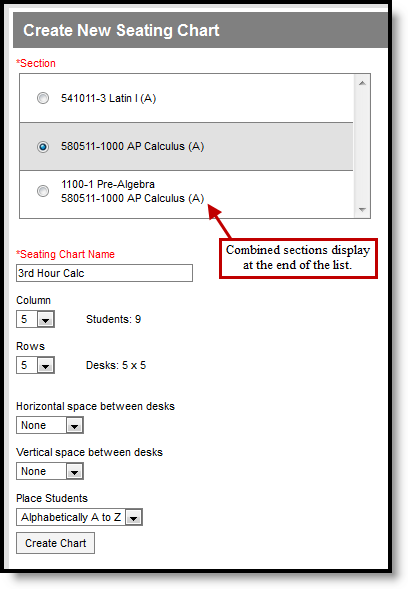
First, establish the parameters of the chart.
- Click New in the top corner of the seating chart list.
- Select the Section you're creating a chart for.
If you teach multiple sections in the same period, scroll to the bottom of the list to view combined sections.
- Enter a Name for the chart. Names cannot be changed once the seating chart is created.
- Select the number of Columns and Rows to indicate how many desks to include in the chart. The number of students in the section appears below the Name.
- Indicate the default Space Between Desks.
- If you want to automatically fill the chart with students, select the Place option you'd like to use, Alphabetically A to Z, Alphabetically Z to A, or Random. If you would rather fill desks manually, select Do Not Place. Students names display in a list from which you can place them in desks.
- Click Create Chart to create a chart based on the parameters you selected and view the chart.
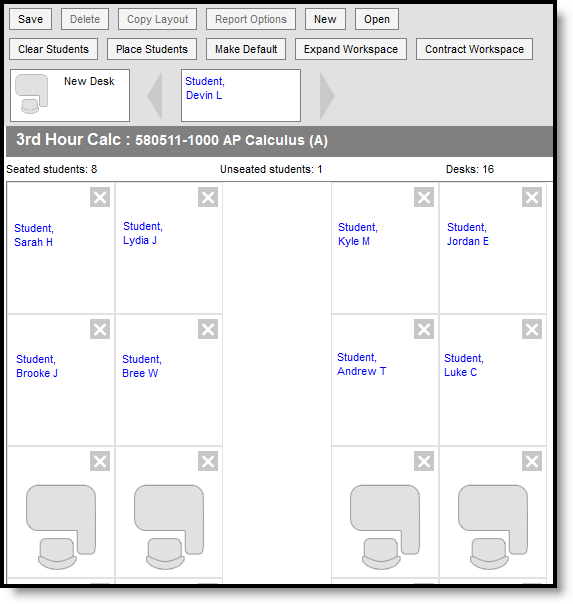
The seating chart fills based on the parameters you selected, but you can click and drag desks into any configuration you'd like. For example, this seating chart represents a class room with two rows of tables, two students at each.
Once you've finished the chart, click Save to add it to your chart list.
Click and Drag Logic
The following logic applies to manually placing students in the chart.
- Desks can be arranged in any configuration but cannot overlap.
- Click and drag the New Desk icon to add an empty desk to the chart.
- Click and drag unseated students from the list at the top into empty spaces.
- Click the X on a student to move them to the unseated list. Click the X on a desk to remove that desk from the chart.
- Moving a student to a space without a desk also moves the student's desk.
- Moving a student to another desk leaves an empty desk behind.
- Moving a student to a space where there isn't a desk adds another desk to the chart.
- Moving an unseated student (A) to a desk that already has another student (B) moves student B to the unseated list. If students A and B are both seated, they'll trade desks.
Additional Options
The following table describes the additional options at the top of the seating chart.
| Option | Action |
|---|---|
| Delete | Deletes this seating chart. |
| Copy Layout | Copies this desk layout to a new chart. |
| Report Options | Opens the printing options for the chart. |
| Clear Students | Moves all students to the unseated student list. |
| Place Students | Places all unseated students into empty desks based on the option selected, Alphabetically A to Z, Alphabetically Z to A, or Random. |
| Make Default | Makes this desk layout the default organization. You could use this option if you teach in the same room for multiple sections and want to reuse the physical layout of the room. |
| Expand Workspace | Expands the scrollable area of the chart, useful for larger classrooms. |
| Contract Workspace | Contracts the scrollable area of the chart. |


