Tool Search: Funding Report
The Attendance Funding Report prints district-level summaries of membership and attendance for funding. This report does not count students with the state exclude flag marked on their enrollment.
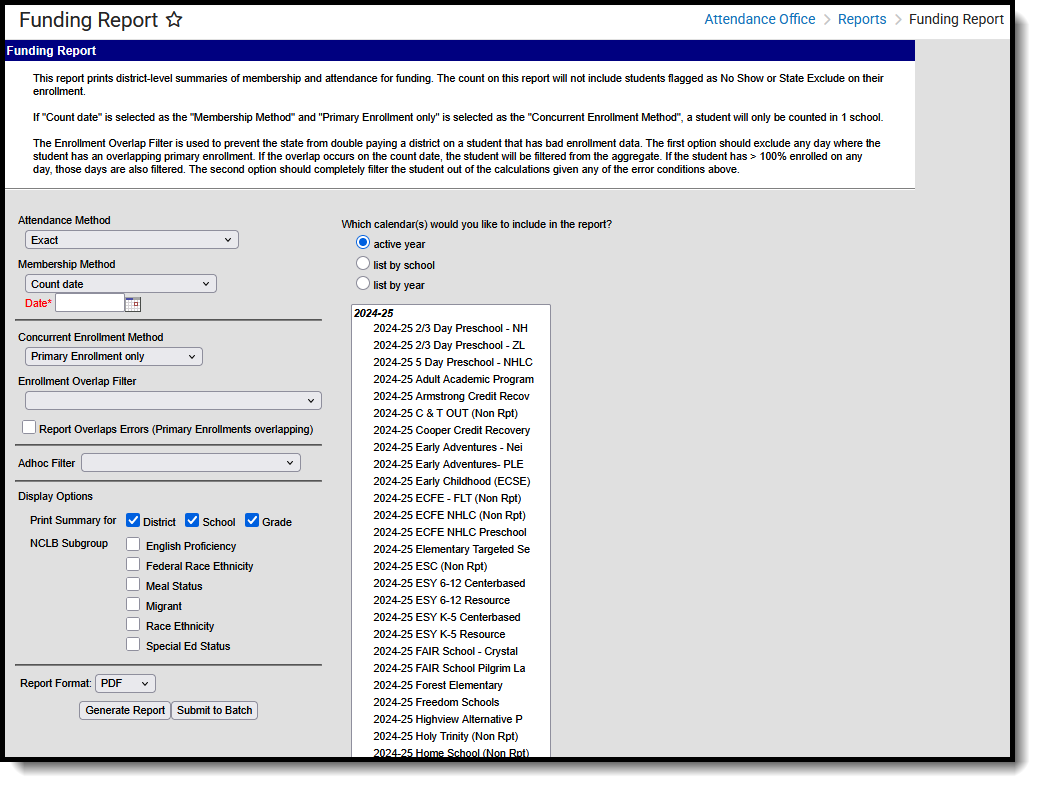 Funding Report
See the Attendance Reports Tool Rights article for information on available tool rights.
Report Logic
The following logic applies to various calculations in the Attendance Funding Report.
| Calculation | Description |
|---|---|
| ADA (Average Daily Attendance) | A group ADA, as used in this report, is calculated by dividing the sum of present days of all students by the total possible instructional days (days marked for instruction on the calendar) for the date or date range selected. This calculation relies on the amount of time a student is expected to be in class, or the "student day" minutes, which is a value defined by a state or other funding entity. Depending on state requirements, ADA can be calculated using whole/half day approximations, or as an exact figure, found by multiplying a student's total number of present minutes for a day by the student's Percent Enrolled in decimal form. |
| ADM (Average Daily Membership) | An ADM calculation provides the average aggregate number of enrolled students in a school/district for a defined period of time. ADM is calculated by dividing the sum of each student's actual membership days by the total possible instructional days (days marked for instruction on the calendar) and, if necessary, adjusted by his/her percent of enrollment. |
| Total | Found by adding the values provided in a section together. |
| Attendance Rate | Attendance Rate is commonly expressed as a percent and is found by dividing ADA by ADM and multiplying the result by 100 (ADA/ADM x 100). |
| Membership Days | Membership Days are days when a student is considered an enrolled school member and is expected to be attending school. |
Report Editor
The following information details the different areas of the Attendance Funding Report editor.
| Option | Description |
|---|---|
| Calculation Method | |
| Attendance Method | The Attendance Method dropdown list controls how attendance is reported in the extract, either as an Exact calculation or as a Daily Approximation, rounded to half and whole days. The Exact Calculation option sums the student's absent minutes and divides that value by the student day minutes. The same calculation is used when the Use percent enrolled in ADM calculation is marked, but the Percent Enrolled column from the Enrollment table is also considered. The Daily Approximation option uses the whole day/half day minutes entered on the Calendar to determine total absent days. If the student's total daily absent minutes match or exceed the value entered in the Whole Day Absence field, the student has 1 day of absence. If the student's total daily absent minutes match or exceed the value entered in the Half Day Absence field but are less than the value entered in the Whole Day Absence field, the student has .5 days of absence. |
| Membership Method | Selection indicates how ADM is calculated - by a single Count Date or by Average Daily Membership over a date range. ((Membership Days) * (Percent Enrolled / Instructional Days)). |
| Date Fields | When the Membership Method is Average Daily Membership, a range of dates needs to be entered to properly calculate the the ADM. If dates are not entered, the calculation uses the start and end dates of the school year. When Count Date is selected, a single date representing the count date is required. |
| Enrollment Method | |
| Concurrent Enrollment Method | The Concurrent Enrollment Method dropdown list allows the user to select if the report should pull students' Primary Enrollment only or Use Percent Enrolled Fractions to draw data from multiple enrollments per student, if applicable. This selection controls what options are available in the Enrollment Overlap Filter, which is meant to prevent incorrect data from appearing on the report. |
| Enrollment Overlap Filter | This filter allows data to be reported correctly when students have overlapping primary enrollments (which may be incorrect, resulting in bad data) If Primary Enrollment Only is selected in the Concurrent Enrollment Method dropdown list, the following options will be available in the Enrollment Overlap Filter:
If Use Percent Enrolled Fractions is selected in the Concurrent Enrollment Method dropdown list, the following options will be available in Enrollment Overlap Filter:
|
| Report Overlaps Errors | If the district summary is chosen and the district has overlaps, information will appear at the end of the report that notes the students with an overlapping primary enrollment and a summary of the days of overlap on the ADM. These options are selected to avoid double-counting of a student who has potentially bad enrollment data. The Report Overlap Errors (Primary Enrollments overlapping) checkbox will add an additional page onto the report that shows all students who would be excluded from the report, so that users can then examine student data for errors. The Report Overlap Errors (over 100% Enrollments overlapping) checkbox will add an additional page onto the report that shows all students who would be excluded from the report, so that users can then examine student data for errors. |
| Student Selection | |
| Ad hoc Filter | Selecting an ad hoc filter will return only those students who are included on the filter and who match the reporting logic of the report. |
| Display Options | |
| Print Summary | Funding information can be printed for the District, the School, the Grade Level, or all three. |
| NCLB Subgroup | The Attendance Funding Report can be summarized by any combination of district, school and grade. Users can also choose to have information sorted by six different NCLB subgroups. See the NCLB Subgroups section for additional information. All subgroups can be chosen if desired. |
| Print and Calendar Selections | |
| Calendar Selection | At least one calendar must be chosen in order to generate this report. Calendars can be listed by Active Year, by School or by Year. Use the CTRL or SHIFT keys to select multiple calendars. |
| Report Format | Determines how the report generates - PDF or DOCX. |
| Report Generation | To display the results of the report immediately, click the Generate Report button. This is best if the selection criteria is small (one or two calendars, a short date range, a smaller student selection, etc.). To displays the results of the report at a later time, click the Submit to Batch button. This is best if the selection criteria is large (several calendars, a large date range, a large student selection, etc.). When this is done, a message displays asking for the selection of more Batch Queue options. See the Batch Queue article for more information. |
NCLB Subgroups
Reporting Group | Definition | Location |
|---|---|---|
English Proficiency | Indicates that student is receiving services to reach a state-defined level of English proficiency. | Student Information > Program Participation > English Learners (EL) LEP.lepStatus |
Federal Race Ethnicity | How a student is categorized based on federally-defined race/ethnicity categories. Options include:
| Census > People > Demographics > Race/Ethnicity > Federal Designation Identity.raceEthnicityFed |
Meal Status | Indicates student meal status using state codes. Common codes are:
| FRAM > Eligibility > Eligibility POSEligibility.eligibility |
Migrant | Indicates if student is a migrant. | Student Information > General > Enrollments > State Reporting Fields > Migrant Enrollment.migrant |
Race Ethnicity | How a student is categorized based on state-defined race/ethnicity categories. Options vary by state. | Census > People > Demographics > Race/Ethnicity Identity.raceEthnicity |
Special Ed Status | Student's Special Education Status. | Student Information > General > Enrollments > Special Ed Fields > Special Ed Status Enrollment.specialEdStatus |
Generate the Report
- Select the Attendance Method from the dropdown list.
- Select the Membership Method from the dropdown list.
- Enter the required dates for the selected methods.
- Select the Concurrent Enrollment Method from the dropdown list.
- Select the Enrollment Overlap Filter.
- Mark the Report Overlap Errors checkbox, if applicable.
- Select a group of students from the Ad hoc Filter dropdown list, if desired.
- Select the Print Summary options for the report.
- Select the desired NCLB Subgroup options.
- Select which Calendar(s) to include in the report and how to sort the calendars, active year, by school or by year.
- Select the desired Report Format.
- Click the Generate Report button to display the results immediately. Click the Submit to Batch button to choose when the report generates.
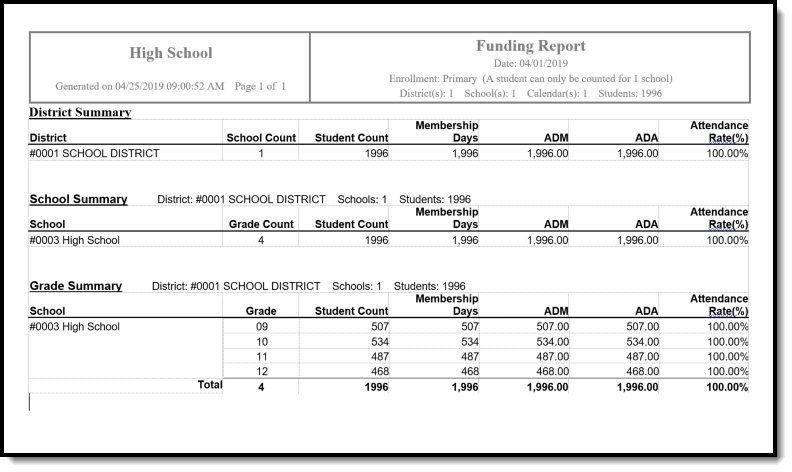
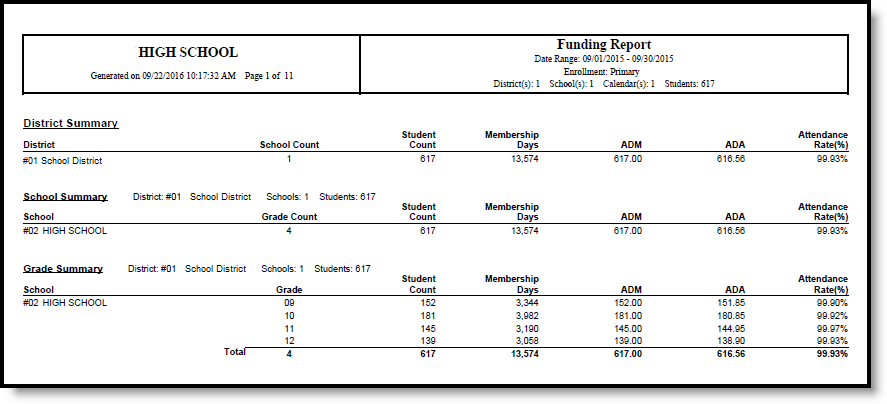
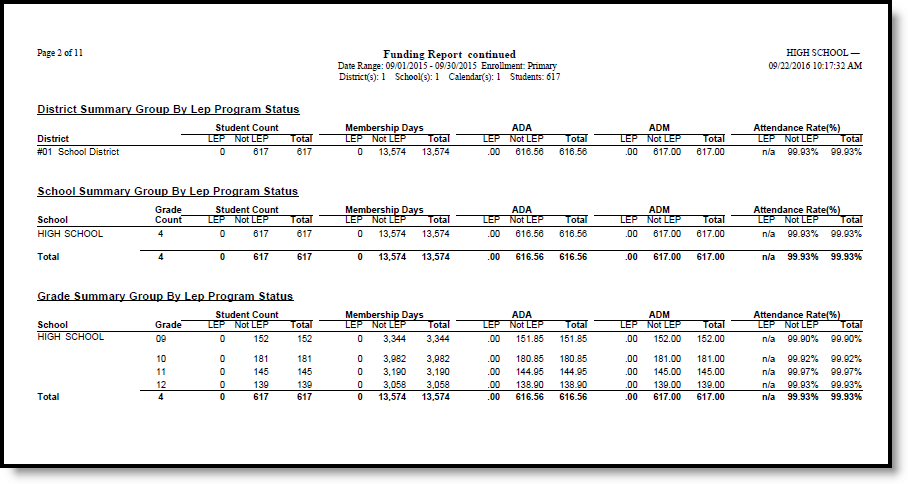
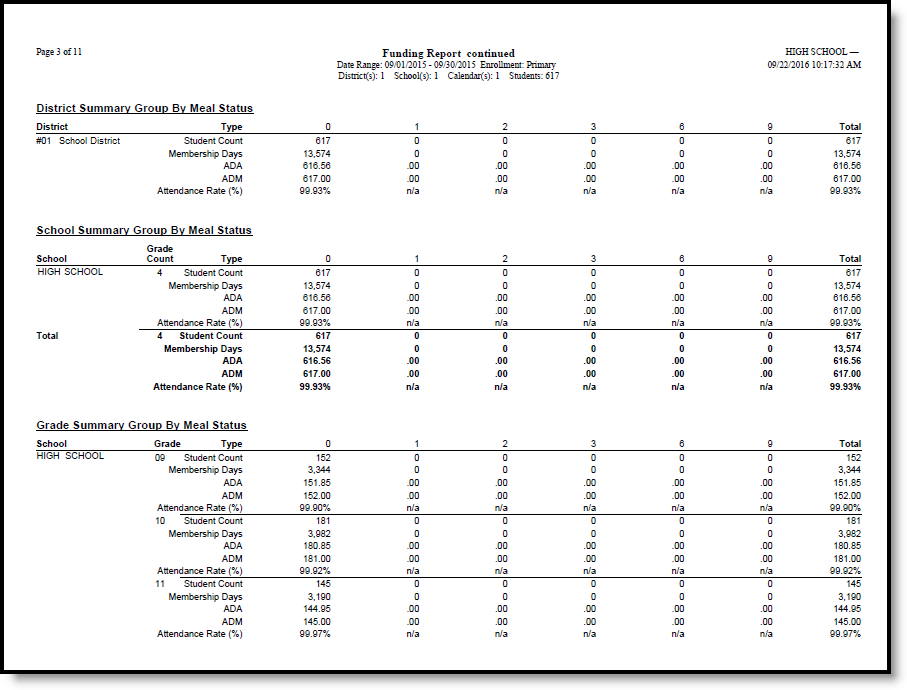
The following sample images of the report are based on all options for Print Summary and all six NCLB Subgroups being selected.
Note the following information about the Report Layout:
- The Student Count column in the report is a count of all enrollments by status. A student who changes status (and has a new enrollment) during the date range is counted twice in the Student Count column. Unless the Primary Enrollment Only option is selected (then, the student is only counted once).
- The header columns on the NCLB Subgroups (printed beginning on page 3) are the attribute dictionary codes assigned to the values. Only active codes display as labels; inactive codes are grouped in an Other column. Students who do not have a value entered for the attribute are counted in an Undefined column.
- Up to 13 codes print. Data in codes higher than 13 print in a column labeled Other.
- The Total includes data from all active and inactive codes (including ones that are not printed).
