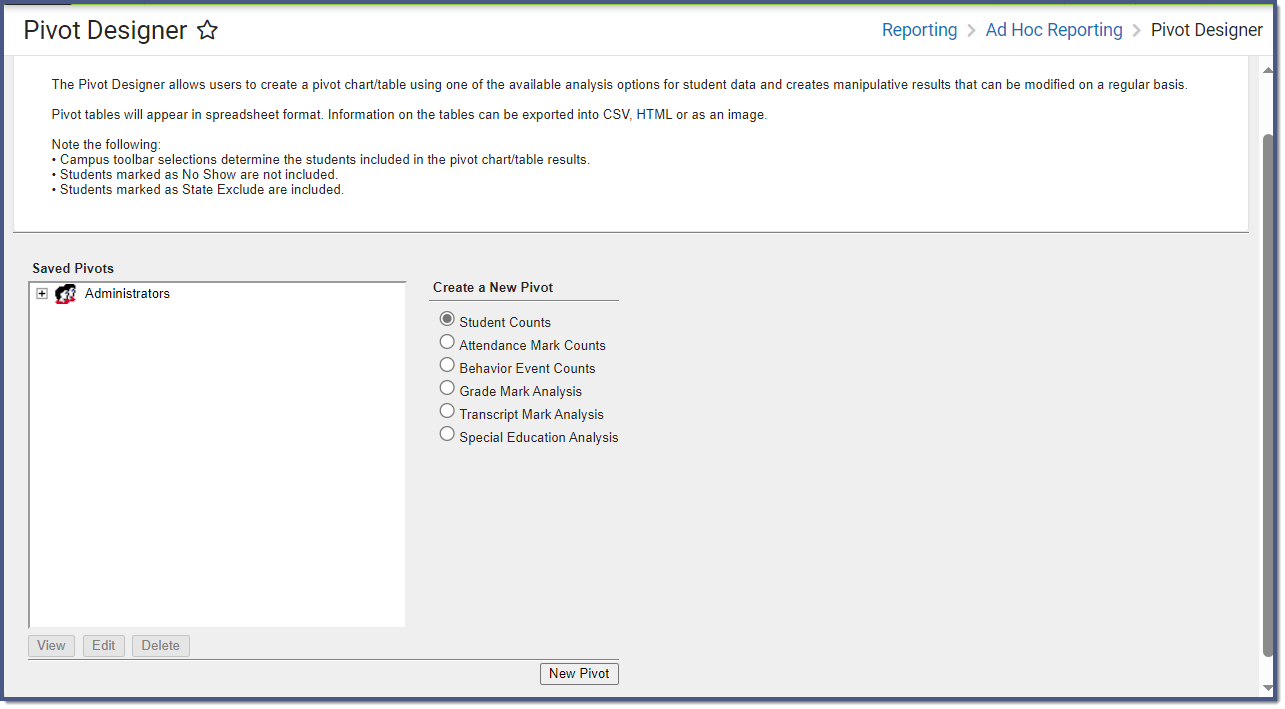
The Pivot Designer tool allows users to analyze, interpret, and visually present crossed-referenced data in easy-to-understand charts and graphs. For example, a list of students in a specific grade level can be selected and cross-referenced with their attendance records, behavior incidents, and semester grades. This data can then be displayed in a chart, facilitating comparison and analysis.
This tool uses pivot table functionality. A pivot table is a data summation tool often found in spreadsheets and other business intelligence software. Pivot table tools can sort, count, and total the data stored in a table or spreadsheet, and then display the data in a new table or chart.
This tool is designed for Administrators and select power users. Users working within or viewing a Pivot Designer report can see data for tools for which they may not have tool rights to access (except FRAM). Calendar rights are respected, as pivots will not display data from calendars for which a user lacks access. Users must have at least modify rights to a calendar in order to create a new pivot.
We recommend saving pivots to specific User Groups or as an Outline Link to control user access.
Count of Students is the default Measure on the field list.
Attendance Mark Counts
Students' attendance records
Students must be on the roster to report.
Students must have at least one attendance event.
Each attendance event counts as one.
No-show students are not included.
Students marked as State Exclude are included.
Sum of Period Absences is the default Measure on the field list.
Behavior Event Counts
Students' behavior records
Each behavior event is counted as 1.
No-show students are included.
Students marked as State Exclude are included.
Count of Behavior Events is the default Measure on the field list.
Grade Mark Counts
Total Number of Students Enrolled + GPA + Credits Earned
GPA is based on the student's Grades tab.
Credits Earned is based on the student's Transcript tab.
Each credit earned counts as 1.
No-show students are included.
Students marked as State Exclude are included.
Count of Grades, Sum of Credits Earned, and Weighted Term GPA are the default Measures on the field list.
Transcript Mark Counts
Students' transcripts
Only students who have transcript credits on the Transcript tab are included.
Each posted transcript credit on a student's Transcript tab counts as one.
No-show students are included.
Students marked as State Exclude are included.
Count of Transcript Records, Sum of Credits Earned, and Transcript GPA are the default Measures on the field list.
Special Education Analysis
Students with a special education record.
Students must have a locked IEP in order to report.
No-show students are included.
Students marked as State Exclude are included.
Count of Special Education students is the default Measure on the field list.
Step 2. Determine Pivot Information, Dimensions, Measures, and Filters
Once a pivot type is selected, you must determine the pivot information, any filters or measures to apply, and the dimensions to be used for reporting.
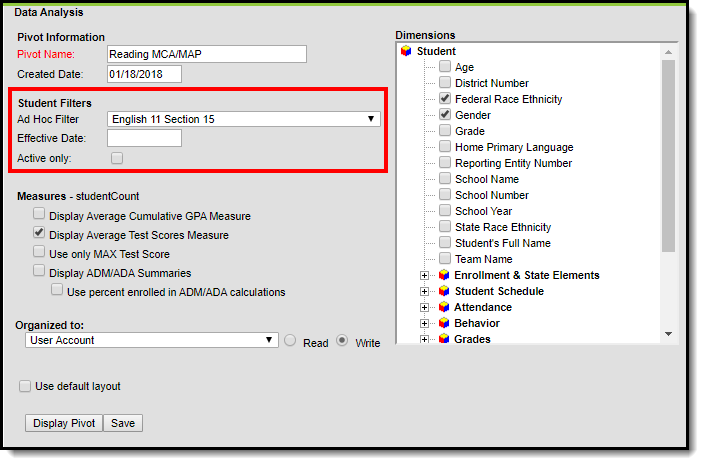
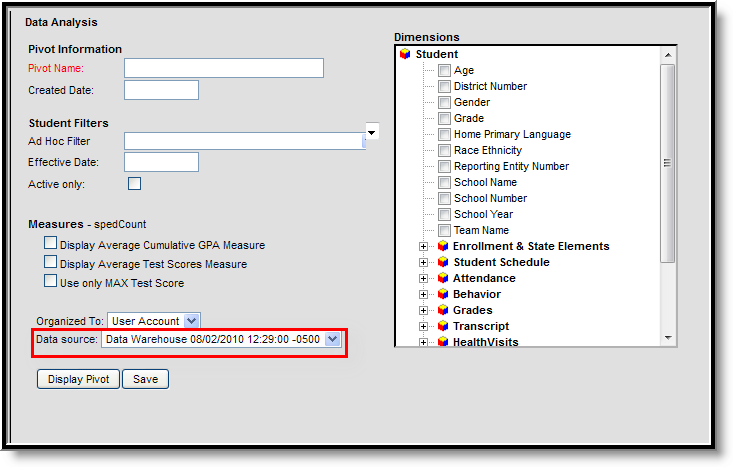
Pivot Information
Pivot Information fields are used for identification purposes, so you can more easily locate and reuse this pivot in the future.
A Pivot Name is required for all pivots (unless the pivot will be used immediately and not saved).
The Created Date indicates when the pivot was first created.
Student Filters
Users can select an Ad hoc Filter that contains specific students who will make up the population reported in the pivot. If an Effective Date is entered, only students who are actively enrolled as of this date are included in the pivot. Selecting the Active Only checkbox forces the pivot to return only students enrolled on the current date (today).
The Pivot Designer does not recognize filter operators applied in the Filter Designer for the Ad Hoc. It only sees a list of personIDs generated by the Ad Hoc filter and pulls data from the pivot dimensions and measures.
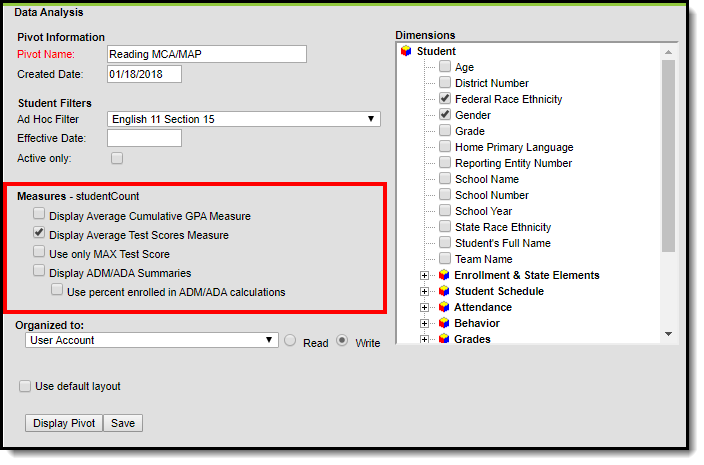
Measures
Select the desired measures for the pivot table. These options vary based on the type of pivot selected.
Measure Descriptions
Measure
Description
Pivot Type
Display Average Cumulative GPA Measure
The pivot displays the Average Cumulative GPA for all reported students. If selected, the view v_CumGPA is used to generate results.
Student Counts
Attendance Mark Counts
Behavior Event Counts
Grade Mark Analysis
Transcript Mark Analysis
Special Education Analysis
Display Average Test Scores Measure
The pivot will display students' average test scores.
Student Counts
Attendance Mark Counts
Behavior Counts
Grade Mark Analysis
Transcript Mark Analysis
Special Education Analysis
Use only MAX Test Score
The pivot will display the students' highest test scores.
Student Counts
Attendance Mark Counts
Behavior Event Counts
Grade Mark Analysis
Transcript Mark Analysis
Special Education Analysis
Display ADM/ADA Summaries
The pivot will display students' Average Daily Membership (ADM) and Average Daily Attendance (ADA).
Student Counts
Use percent enrolled in ADM/ADA calculations
This field determines which views are used for calculating ADM/ADA and whether or not Percent Enrolled is taken into account.
If Percent Enrolled is selected, the following views are used:
v_MembershipAttendance EnrollmentDetailPercent
v_MembershipAttendance DetailPercent
If Percent Enrolled is not selected, the following views are used:
v_MembershipAttendance EnrollmentDetail
v_MembershipAttendanceDetail
Student Counts
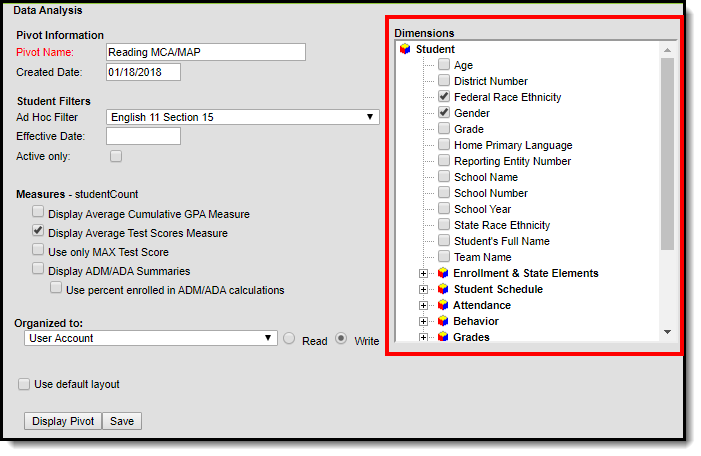
Dimensions
Dimensions allow users to specify which data elements are pulled into the pivot table. These data elements are fields found throughout Campus. You must select at least two data elements in order to generate a pivot table. Select data elements by marking the checkbox next to the desired field.
For detailed information about each dimension and data element, see the Understanding Dimensions section below.
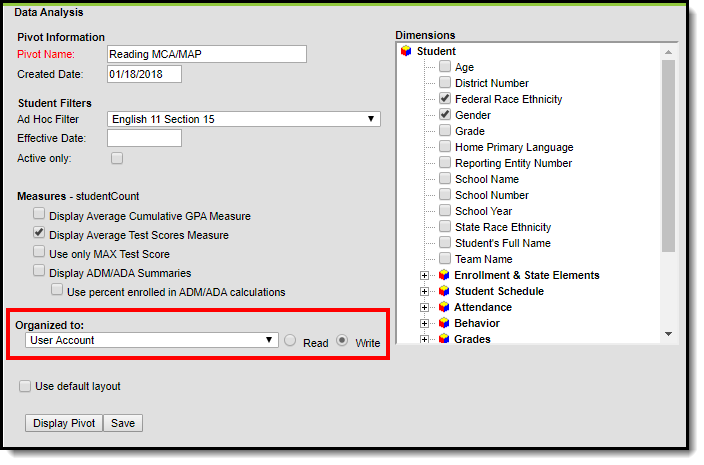
Organized to
This field indicates which user groups are allowed access to the pivot from the Saved Pivots list.
This tool is designed for Administrators and select power users. Users working within or viewing a Pivot Designer report can see data for tools for which they may not have tool rights to access (except FRAM). Calendar rights are respected, as pivots will not display data tied to calendars for which a user lacks access rights.
We recommend saving pivots to specific User Groups or as an Outline Link to control user access.
Marking the Read checkbox means users in this user group can only generate and view the pivot. Marking the Write checkbox means users in this user group can edit and view the pivot.
Data Source
The Data Source determines which database is used when pulling pivot information.
This option is only available to customers who have Data Warehouse Settingsproperly configured.
Use Default Layout
Marking this checkbox will display the pivot in the default format, ignoring any saved modifications made in the Pivot Designer tool.
Understanding Dimensions
Dimensions allow users to specify which data elements are pulled into the pivot table. These data elements are fields found throughout Campus. You must select at least two data elements in order to generate a pivot table.
If All Years and All Schools are selected in the Campus toolbar, the School Name and School Year elements must be selected in order for the pivot to display correct data.
Only dimensions available to all districts are listed. State-specific or Reporting Entity-specific fields are not included.
Student enrollment pivots within the Pivot Designer tool will report data from historical LEP fields and not from new LEP fields.
Data Analysis uses database views to more efficiently pull data into pivots.
The following section describes all available dimensions within Pivot Designer and the mapping and definition of each data element within each dimension.
Dimension Mapping and Definitions
Student
View: cube_student
Element
Mapping and Definition
Age
Census > People > Demographics
This option displays the selected students’ ages, based on the entered birth date.
District Number
District Information > Number
This is the state-assigned district number of the student's enrollment record.
Federal Race Ethnicity
Census > People > Demographics
There are six standard categories of race/ethnicity: American Indian/Alaskan Native, Asian/Pacific Islander, Hispanic, Black (Not Hispanic), and White (Not Hispanic).
Gender
Census > People > Demographics
This element is listed as either Male (M) or Female (F). In some states, a third gender option: Non-Binary (X) is available.
Grade
Student Information > General > Enrollments; Census > People > Enrollments
This is the student’s grade level of enrollment. This grade level is generated from the student’s enrollment record for the selected school year.
Home Primary Language
Census > People > Demographics > Home Primary Language
Reports the selected language most often used in the student's home.
Reporting Entity Number
School Information > School
This is the district- or state-assigned school number of the student's enrollment information.
School Name
Student Information > General > Enrollments
(limited to the school currently selected in Campus Toolbar unless All Schools is selected)
This is the name of the school where the student is enrolled.
School Number
School Information > School > Number
This is the district- or state-assigned school number of the student's enrollment information.
School Year
Student Information > General > Enrollments
(limited to the year currently selected in Campus Toolbar unless All Years is selected)
This is the year of enrollment. This information comes from the calendar and the student’s enrollment record.
State Race Ethnicity
Census > People > Demographics
For states that use designations different from the Federal Race Ethnicity requirements, this option is available.
Team Name
Student Information > General > Schedule > Walk-in Scheduler
This is the team a student is assigned to for scheduling purposes. If the student is assigned to a team, the team name will display in a dropdown list of the Walk-in Scheduler.
Enrollment and State Elements
View: cube_enrollment
Student Information > General > Enrollments
These elements are displayed in the General Enrollment and State Reporting Enrollment editors and are used in several reports throughout Campus and in state reporting extracts. Many elements are renamed to aid in state reporting. For example, the field 'language' may be renamed 'Language Background'. Meal Status information is now reported from the Eligibility tool found in the Food Service view.
This option lists the course name and number, as well as the section number andperiod meeting time.
Department
Scheduling > Courses
The department is a sorting feature that can be assigned to the course. When used in the pivot, the department name will appear and can be used to sort departments by course.
Secondary Teacher Name
Scheduling > Courses > Sections
Name of an additional teacher assigned to the course section.
Section Period Name
Scheduling > Courses > Sections
The section period name lists the period in which the section meets.
Section Term Name
Scheduling > Courses > Sections
The section term name lists the term in which the section meets.
Teacher Name
Scheduling > Courses > Sections
Name of the teacher assigned to teach the course section.
Teacher's Education Level
Census > People > District Employment
The code associated with a teacher’s education level (e.g., 5 for a Bachelor’s degree, 2 for a Doctorate degree).
Teacher's Gender
Census > People
The gender of the teacher.
Teacher's Race/Ethnicity
Census > People
The code for the teacher's race/ethnicity.
Teacher's Seniority
Census > People > District Employment
The code associated with the teacher's seniority level (e.g., T for tenure, 1 for 1st year).
Attendance
View: cube_attendance
When a new pivot is built, if Student Counts is selected, SQL creates an INNER JOIN between two views. This means student counts will reflect only students with attendance records.
Element
Mapping and Definition
Attendance Course/Section
Student Information > General > Attendance; Scheduling > Courses > Section
The attendance course/section lists the course numbers, names, and sections associated with attendance events. If attendance entries were recorded for 0012 English Sections 1 and 3, the pivot can display 0012 English with attendance events broken down by Sections 1 and 3, and the total number of attendance events across all sections of the course.
Attendance Period Name
Student Information > General > Attendance
System Administration > Calendar > Calendar > Periods
The attendance period name lists the periods, as labeled in the school calendar.
Attendance TeacherName
Student Information > General > Attendance; Scheduling > Courses > Section
This field lists the teacher's Display Name who recorded the attendance. Most often, this will be the section's teacher.
Attendance Term Name
Student Information > General > Attendance; System Administration > Calendar > Calendar > Terms
The attendance term name lists the name of the terms, as labeled in the school calendar.
Course Department
Student Information > General > Attendance; Scheduling > Courses
The department is a sorting feature that can be assigned to the course. When this is used in Data Analysis, the department name will appear and can be used to sort departments by course.
Excuse Reason
Student Information > General > Attendance; System Administration > Attendance > Attendance Codes
The reason attached to an attendance event (e.g., illness, denied busing, parent excuse). These codes are created in the System Administration area.
Excuse Type
Student Information > General > Attendance; Attendance Office > Attendance Codes
The excuse attached to the attendance status (e.g., excused, unknown).
Status
Student Information > General > Attendance;Attendance Office > Attendance Codes
This is an attendance status (e.g., tardy, early release).
Behavior
View: cube_behavior
Element
Mapping and Definition
Alignment
Student Information > General > Behavior (tab) > Behavior > Incident Detail > Alignment
Alignment refers to whether the student requires discipline or reward as a result of his/her involvement in the event.
Context
Student Information > General > Behavior(tab)> Behavior > Incident Detail > Context
Context refers to the relative time (opposed to specific time) of the behavior incident.
drugCode
Student Information > General > Behavior(tab)> Behavior > Incident Detail > Events and Participants > Event Details > Drug
Used in state reporting. The reported code refers to the drugs associated with the behavior event.
Event
Student Information > General > Behavior(tab)> Behavior > Incident Detail > Event Type Behavior > Admin > Event Types
Behavior event types are configured in the System Administration module and used when recording student behavior incidents.
Event Code
Student Information > General > Behavior(tab)> Behavior > Event Type Code Behavior Admin > Event Types > Behavior Event Type Detail > Code
Event codes are used in state reporting for certain states. If a code is created in System Administration, the pivot will display with that code for student behavior events.
Event Code BIE
Student Information > General > Behavior(tab)> Behavior > BIE Event Type Code Behavior Admin > Event Types > Behavior Event Type Detail > Code
BIE Event codes are BIE-specific. If a code is created in System Administration, the pivot will display with that code for student behavior events.
Injury
Student Information > General > Behavior(tab)> Behavior > Incident Detail > Injury
This field reports the injury inflicted upon the participant of the behavior event.
Location
Student Information > General > Behavior(tab)> Behavior > Incident Detail > Location
Location refers to the place where the incident occurred while the behavior event was taking place.
Location Code BIE
Student Information > General > Behavior(tab)> Behavior > Incident Detail > BIE Location
The BIE-specific location of the place at which the incident was taking place while the behavior event occurred.
medicalServiceProvided
Student Information > General > Behavior(tab)> Behavior > Incident Detail > Medical Service Provided
Indicates whether medical service was provided to a participant of the behavior event.
Referring Staff
Student Information > General > Behavior(tab)> Behavior > Incident Detail > Submitted By
This field reports the name of the school employee who recorded the behavior event.
Regional Event Code
Behavior > Admin > Event Types > Behavior Event Type Detail > School Code
This is the district's code for the event, which may differ from the state code.
Regional Res Code
Behavior > Admin > Resolution Types > Behavior Resolution Type Detail > School Code
This is the district's code for the resolution, which may differ from the state code.
Resolution
Student Information > General > Behavior(tab)> Behavior > Incident Detail >Events and Participants> Resolution Type Behavior > Admin > Resolution Types
For each behavior event, a resolution can also be entered. The list of resolutions is set up in the System Administration module. In Data Analysis, the resolution will be listed as the type of resolution assigned to a student's behavior event.
Resolution Code
Student Information > General > Behavior(tab)> Behavior > Incident Detail >Events and Participants> Resolution Behavior > Admin > Resolution Types > Behavior Resolution Type Detail > Code
Resolution codes are used in state reporting for certain states. The resolution code is created in System Administration. If this code is used, information in the pivot will display with that code for student behavior resolutions.
Resolution Code BIE
Student Information > General > Behavior(tab)> Behavior > Incident Detail >Events and Participants> BIE Resolution Behavior > Admin > Resolution Types > Behavior Resolution Type Detail > Code
BIE resolution codes are BIE-specific. The resolution code is created in System Administration. If this code is used, information in the pivot will display with that code for student behavior resolutions.
Role
Student Information > General > Behavior(tab)> Behavior > Incident Detail >Events and Participants> Role
A student’s behavior role is assigned to a behavior event and lists the student's participation in that event (e.g., Offender, Participant, Victim).
Role BIE
Student Information > General > Behavior(tab)> Behavior > Incident Detail >Events and Participants> BIE Role
A student’s BIE-specific behavior role is assigned to a behavior event and lists the student's participation in that event (e.g., Offender, Participant, Victim).
stateEventCode
Student Information > General > Behavior(tab)> Behavior > Incident Detail >Events and Participants> State Code Behavior > Admin > Event Types > State Event Code (Mapping)
This field is used in state reporting. The state event code mapped to the event type.
stateResCode
Student Information > General > Behavior(tab)> Behavior > Incident Detail > Events and Participants > Resolution Behavior > Admin > Resolution Types > State Event Code (Mapping)
This field is used in state reporting. The state event code mapped to the event type.
Weapon Code
Student Information > General > Behavior(tab)> Behavior > Incident Detail > Events and Participants > Event Details > Weapon
This field is used in state reporting. On the pivot, this code is associated with a weapon used in a behavior event.
Weapon Code BIE
Student Information > General > Behavior(tab)> Behavior > Incident Detail > Events and Participants > Event Details > BIE Weapon
This field is used in state reporting. On the pivot, this BIE-specific code is associated with a weapon used in a behavior event.
Grades
View: cube_grades
Element
Mapping and Definition
Grade Course/Section
Student Information > General > Grades Scheduling > Courses
This option lists the course name for the section to which the student is scheduled.
A credit group is a category of credits a student earns for completing grading tasks or achieving a certain score level.
Grade Credit Type
Student Information > General > Grades Scheduling > Courses > Grading Tasks Grading & Standards > Credit Groups
Credit types are the categories in a Credit Group (e.g., English, History).
Grade Period Name
Student Information > General > Grades Scheduling & Courses > Calendar Setup > Period Setup
The grade period name lists the period name, as labeled in the school calendar.
Grade Score
Student Information > General > Grades Grading & Standards > Score Groups & Rubrics
This is the letter grade or percentage grade a student has earned for a grading task.
Grade Term Name
Student Information > General > Grades Scheduling & Courses > Calendar Setup > Term Setup
The grade term name lists the terms, as labeled in the school calendar.
Task Name
Student Information > General > Grades Scheduling > Courses > Grading Tasks
This is the name of the task that is being graded.
Teacher
Student Information > General > Grades Scheduling & Courses > Courses > Section Information
The teacher field lists the Display Name of the teacher selected to teach that section.
Transcript
View: cube_transcript
Element
Mapping and Definition
Course Name
Student Information > General > Transcript Scheduling & Courses > Course Information
This option lists the course name that appears on the student’s transcript. It comes from the transcript record or, when the transcript is posted, the student’s schedule.
Grade Taken
Student Information > General > Transcript Student Information > General > Enrollments
This is the student’s grade of enrollment (10, 11, 12, etc.) at the time he/she attempted and/or completed the transcript course.
State Standard
Student Information > General > Transcript Scheduling > Grading & Standards > Standards Bank
If the transcript entry is associated with a grading standard, it will be listed in this area.
Transcript Credit Type
Student Information > General > Transcript Scheduling & Courses > Courses > Course Grading Tasks Grading & Standards > Credit Groups
Credit types are the categories in a Credit Group (e.g., English, History).
Transcript Credit Group
Grading & Standards > Credit Groups
This is the category of course credits used to organize courses and graduation requirements.
Transcript Mark Year
Student Information > General > Transcript Scheduling & Courses > Calendar Setup > School Years
This is the school year the course was completed. If a course was completed in the 2003-2004 school year, the field would report as 2003-2004.
Transcript Score
Student Information > General > Transcript Grading & Standards > Score Groups & Rubrics
This is the letter grade or percentage grade a student has earned for a course.
Health Visits
View: v_HealthVisitDetail
Element
Mapping and Definition
Complaint Type
Student Information > Health > Health Office Visits > New > Complaint(s) Student Information > Health Administration > Health Complaint Type Setup
Indicates the type of complaint assigned to the student's visit to the Health Office.
Discharge Type
Student Information > Health > Health Office Visits > Discharge(s) Student Information > Health Administration > Health Discharge Type
Indicates the discharge action assigned to the student's visit to the Health Office.
Intervention Type
Student Information > Health > Health Office Visits > Interventions(s) Student Information > Health Administration > Health Intervention Type
Indicates the assigned care noted on the health office visit record in response to the observation.
Intervention Type Item
Student Information > Health > Health Office Visits > Interventions(s) Student Information > Health Administration > Intervention Type
Indicates specific action given in response to the selected intervention.
Observation Type
Student Information > Health > Health Office Visits > Observation(s) Student Information > Health Administration > Observation Types
Indicates the issue the health office staff noted when the student arrived for treatment.
Observation Type Item
Student Information > Health > Health Office Visits > Observation(s) Student Information > Health Administration > Observation Type
Indicates specific action given in response to the selected intervention.
Recorded By (Full Name)
Student Information > Health > Health Office Visits > Recorded By
Staff who recorded the student's visit.
Student's Full Name (Health Visits)
Student Information > General > Summary
Student who visited the Health Office.
Medication
View: v_MedicationDetail
Element
Mapping and Definition
Comments/Precautions
Student Information > Health > Medications > Comments/Precautions
Notes about the student's medication record.
Date Submitted
Student Information > Health > Medications > Date Submitted
Indicates the date the medication information was given to the school.
Directions
Student Information > Health > Medications > Directions for Use
Lists how to administer the medication, as directed by the student's medical professional.
Doses Remaining
Student Information > Health > Medications > Remaining Doses
Lists the remaining medication doses on site.
Doses Submitted
Student Information > Health > Medications > Doses Submitted
Total number of doses given to the school by the parent/guardian.
Medication Form
Student Information > Health > Medications >Medication Form
Form of the medication (e.g., tablet, capsule, etc.)
Medication Name
Student Information > Health > Medications >Medication Name
The name of the medication that is administered to the student.
Notification Threshold
Student Information > Health > Medications > Notification Threshold
Number at which the parent is notified that more doses are needed.
Recorded By (Full Name)
Student Information > Health > Medications >Recorded By
Health office staff who recorded the medication.
Student's Full Name (Medication)
Student Information > General > Summary
Student receiving the medication.
Special Education
View: cube_sped
Element
Mapping and Definition
Disability
Student Information > General > Enrollments > Special Ed Fields > Special Education Disability Setting
Student's assigned disability.
Evaluation Name
Student Information > Special Education > Documents > Evaluation > Evaluation Editor
Name of the evaluation assigned to the student.
Evaluation Result Disability
Student Information > Special Education > Documents > Evaluation > Results and Eligibility
Notes the student's evaluation results and disability to receive services.
Evaluation Result Eligibility
Student Information > Special Education > Documents > Evaluation >Results and Eligibility
Notes the student's evaluation results and eligibility to receive services.
Plan Manager Name
Student Information > Special Education > Team Members
Name of the staff person responsible for the student's plan (case manager).
Plan Name
Student Information > Special Education > Documents > Plan
Name of the plan assigned to the student.
Primary Disability
Student Information > General > Enrollments > Special Ed Fields > Primary Disability
The primary disability assigned to the student.
Secondary Disability
Student Information > General > Enrollments > Special Ed Fields > Secondary Disability
The secondary disability assigned to the student.
Service Name
Student Information > Special Education > Documents > Plan > Services Editor > Services
The service a student is receiving as noted on his/her Education Plan.
Service Position
Student Information > Special Education > Documents > Plan > Services Editor > Service Position
The selected service position the student is receiving.
Service Provider Name
Student Information > Special Education > Documents > Plan > Services Editor > Service Provider
The person/organization providing the service.
Service State Code
Student Information > Special Education > Documents > Plan > Services Editor > Services
State code assigned to the service, if applicable.
Special Education Exit Reason
Student Information > General > Enrollments > Special Ed Fields
Reason student is no longer receiving services.
Special Education Setting
Student Information > General > Enrollments > Special Ed Fields
Student's special education setting.
Special Education Status
Student Information > General > Enrollments > Special Ed Fields
Student's special education status.
Blended Learning
View: cube_blendedLearning
Element
Mapping and Definition
Assignment End Date
Student Information > General > Attendance > Blended Learning Group
The end date of the student's assignment to the Blended Learning Group.
Assignment Start Date
Student Information > General > Attendance > Blended Learning Group
The end date of the student's assignment to the Blended Learning Group.
Assignment ID
Student Information > General > Attendance > Blended Learning Group
Identifier record of the assigned Blended Learning Group.
Group End Date
Scheduling & Courses > Build Schedules > New Blended Learning Groups
End date of the group.
Group Name
Scheduling & Courses > Build Schedules > New Blended Learning Groups
Entered name of the group.
Group Start Date
Scheduling & Courses > Build Schedules > New Blended Learning Groups
Start date of the group.
Person ID
Scheduling & Courses > Build Schedules > New Blended Learning Groups
Identifier record of the student.
Virtual Today
Scheduling & Courses > Calendar Setup > Day Setup
Indicates the student is in a group that is assigned to the current date to meet virtually.
Virtual Tomorrow
Scheduling & Courses > Calendar Setup > Day Setup
Indicates the student is in a group assigned to meet virtually tomorrow.
Food Service
View: cube_fram
Element
Mapping and Definition
Certified Type
FRAM > Eligibility > Certified Type
The determining reason for the student's reported Eligibility value.
Eligibility
FRAM > Eligibility > Eligibility
Indicates the level of meal service benefits awarded to a student/household.
End Date
FRAM > Eligibility > End Date
The last day on which the student's Eligibility is active.
Opt Out Medicaid
FRAM > Eligibility > Opt Out Medicaid
Indicates the student's guardian has indicated he/she does not wish to be contacted by Medicaid regarding meal benefits.
Opt Out State Child Health Insurance Provider
FRAM > Eligibility > Opt Out SCHIP
Indicates the student's guardian has indicated he/she does not wish to be contacted by SCHIP regarding meal benefits.
School Year
FRAM > Eligibility > School Year
The school year for which the Eligibility applies.
Start Date
FRAM > Eligibility >Start Date
The first day on which the Eligibility applies.
State Code
FRAM > Eligibility > State Eligibility Code
The State Eligibility Code is based on the student's Eligibility status.
Standardized Tests
View: This view is dynamically built from the contents of the Test and TestScore tables.
Assessment > Test Setup > Test Detail Student Information > General > Assessment
Standard tests can be state-required exams by grade level (BSTs, MCAs) or nationwide tests or college-acceptance exams (SATs, ACTs). The pivot reports the Result Codes recorded for each student on each test defined in Campus.
The list of tests and applicable elements will vary by district.
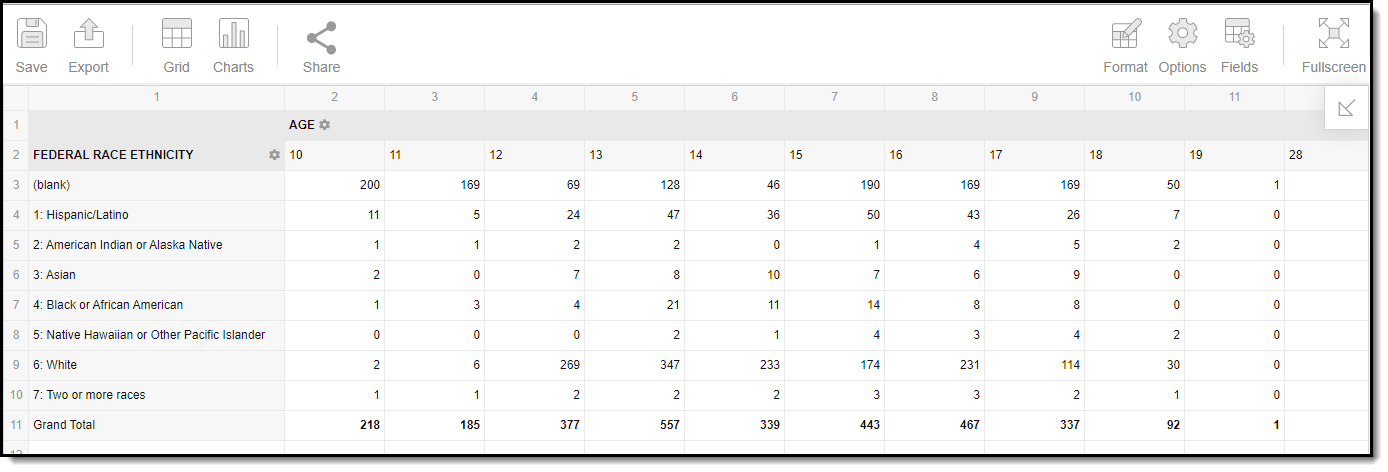
Understanding Pivots
Once pivot elements are defined in the Pivot Designer editor or an existing pivot has been opened, users are directed to the Pivot Designer tool. This tool displays all information generated based on the cross-referenced dimensions. From here, users can further manipulate pivot data and present this information in several visual charts.
Example of a Pivot Table
To filter a dimension, click the gear icon next to the dimension header.
Filtering a Dimension
From here, you can filter dimension data by label or value, as well as modify the dimension sort order. For example, in the image below, filtering the Age dimension by Labels and setting the filter parameter to Equal 9 displays only cross-referenced data for students aged 9.
Example of Filtering a Dimension
Selecting the Fields icon lets you reorder fields in the pivot, add or remove fields from the pivot table, and change which fields are used in rows or columns
Modify Field Options
You can also modify or insert specific calculations for the pivot table by clicking the Add calculated value button (Image 7).When adding calculated values, users can use aggregation keywords to produce aggregates that aren't available when selecting the sigma droplist.
For example, notice in the image below that the first option is Age (Count). The aggregation function is Count. Clicking the Sigma displays Count and Distinct Count only; however, users can modify the aggregation function when creating a calculated value using these additional keywords:
Count
Distinct Count
% of Grand Total (Percent)
% of Column (Percent of Column)
% of Row (Percent of Row)
Add a Calculated Value
In the example below, the personID field was added and applied to the pivot table. This additional field created a second dimension tied to Federal Race Ethnicity.
Applying Field Options
Adding this additional dimension means Federal Race Ethnicity values can now be drilled down to see the personIDs of all students reporting for this Race Ethnicity value.
Drilling Down Dimension Data
You can further drill down on pivot table data by double-clicking on a specific cell. This will display all cross-referenced information in the cell. For example, in the image below, this cell is reporting data for a 10-year-old Asian student with a PersonID of 12300.
Reviewing Cell Data
You can sort each row in ascending or descending order by selecting the arrow icon next to the row name.
Selecting Row Sort Order
You can also access additional options by right-clicking an individual cell.
Right-Clicking a Cell
Example Chart Styles
Pivot data can be displayed visually in a variety of charts. To create a chart, click the Charts icon and select a chart type.
The Column chart displays pivot data in vertical color-coded columns. Colors are defined in the legend at the bottom of the screen. To filter displayed data, select the gear icon next to a data element.
Column Example
Bar
The Bar chart displays pivot data horizontally in color-coded columns. Bar charts work well for tracking changes over time.
Bar Example
Line
The Line graph displays pivot data using color-coded dots and lines. Line graphs are useful for reviewing changes over short and long periods, identifying spikes in data, and detecting trends.
Line Graph Example
Scatter
Scatter charts display pivot data in color and graphically unique points. Scatter charts work best when comparing large numbers of data points without regard to time. For example, you might use a scatter chart to analyze the relationship between two variables such as a person's height and weight.
Scatter Chart Example
Pie
Pie charts display pivot data in a color-coded circle, indicating how much each variable makes up a part of the whole. Pie charts are useful for understanding the relative size or impact of one variable compared to others, or for seeing how a variable has shrunk or grown over time.
Pie Chart Example
Bar Stack
A Bar Stack displays pivot data in color-coded bars representing how much each variable makes up a part of the whole for another variable. Bar stacks are useful for visualizing multiple data types within a single bar.
Bar Stack Example
Bar Line
A Bar Line displays pivot data in vertical color-coded columns. Bar lines are useful for determining trends and the trajectory of data over time.
Bar Line Example
Format and Layout Options
Format options let you modify how cells display data in the pivot table. To access format options, click the Format button and select one of the following options:
Format cells - This editor allows you to control how text within the cell is aligned, what value is reported in the cells, how decimals are used, the current symbol used, any default null value you want the table to display, and whether or not you want data displayed as a percentage.
Conditional formatting - This editor allows you to set cell value thresholds as to whether or not the data is reported for each cell (less than or greater than a certain value), as well as modify the cell text size and font.
Format Cells and Conditional Formatting
The Options menu gives you layout options for how you would like the table to be displayed (Layout), how grand totals are displayed in the table (Grade Totals), and how subtotals should be displayed (Subtotals).
Layout Options
Export and Share Pivots
Pivots contain all data from the Effective Date entered on the Pivot Designer editor to the current date. Because of this, users are unable to do historical comparative analysis of data. Users are strongly encouraged to export data periodically to facilitate comparative analysis.
Click the Export icon and select an option. Pivots can be exported to several formats, including:
HTML
CSV
Excel
Image
PDF
Exporting a Pivot Table
Click the Share icon and select one of the following options to share your pivot with other Campus users:
Tiny URL - Produces a short URL which is useful for texting or emailing to other Campus users.
This option will not preserve any formatting or filtering done to the pivot table. Users will receive the data in the default pivot table format.
Current View URL - Preserves all existing formatting or filtering done to the pivot table; however, this URL will be much longer than the URL provided via the Tiny URL option.
Users attempting to access a pivot table via a shared URL must first be logged into Infinite Campus, have proper calendar and tool rights (to the tool and the data within the pivot) to see the reported data.
Attempting to view a pivot containing data you do not have access rights to will result in a message explaining why you were prevented from viewing it and what rights are required to access it.
Sharing a Pivot Table
View a Pivot
Select the pivot from the Saved Pivots window.
Click the View button to display an existing pivot.
You will be redirected to the Pivot Designer editor, where you will need to click Display Pivot to view your pivot.
Viewing an Existing Pivot
Edit a Pivot
Select the pivot from the Saved Pivot window and click the Edit button.
You will be directed to the Pivot Designer editor, where you can modify existing dimensions and field data.
Select the Save icon to save the modified pivot field data.
Select the Display Pivot button to view modified pivot data.
Editing an Existing Pivot
Delete a Pivot
Select the pivot from the Saved Pivots window and click the Delete button.
You will receive a warning message.
Select OK to delete the pivot, or select Cancel to cancel the deletion.
 Pivot Designer Tool
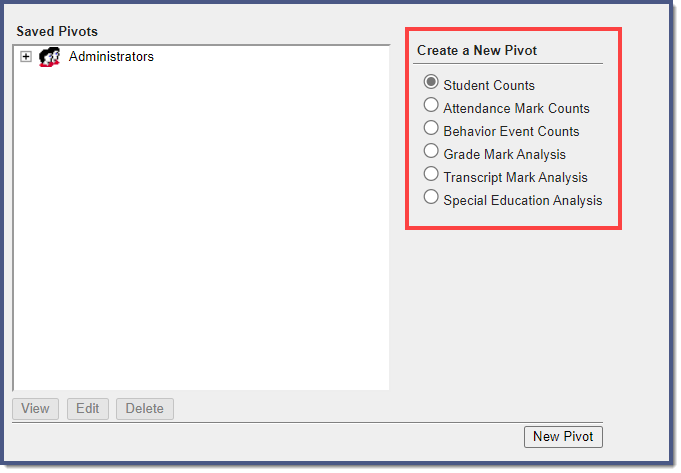 Pivot Types
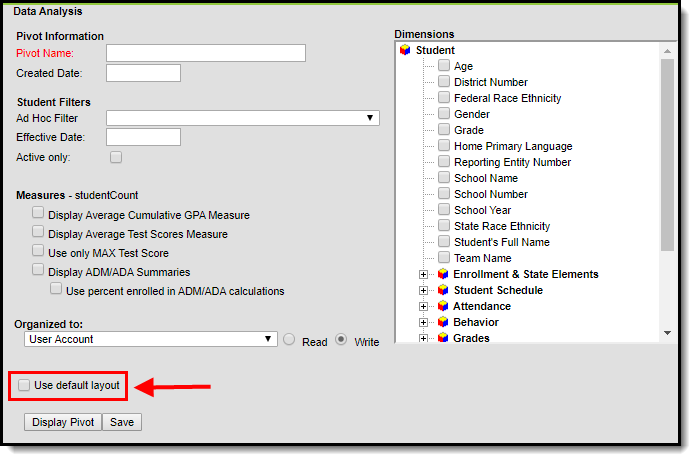 Marking this checkbox will display the pivot in the default format, ignoring any saved modifications made in the Pivot Designer tool.
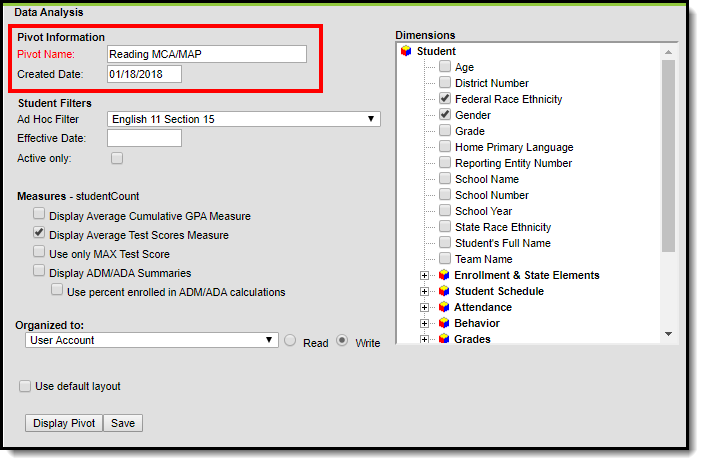
 Example of a Pivot Table
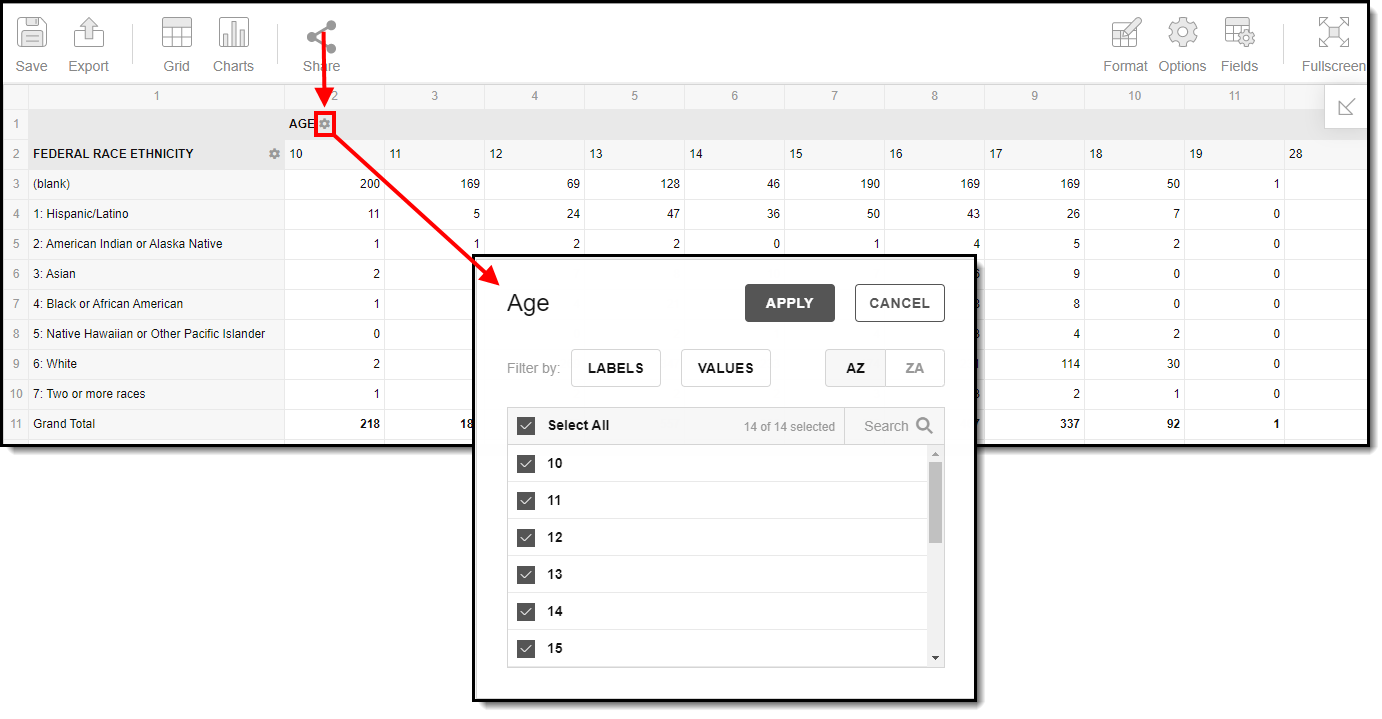 Filtering a Dimension
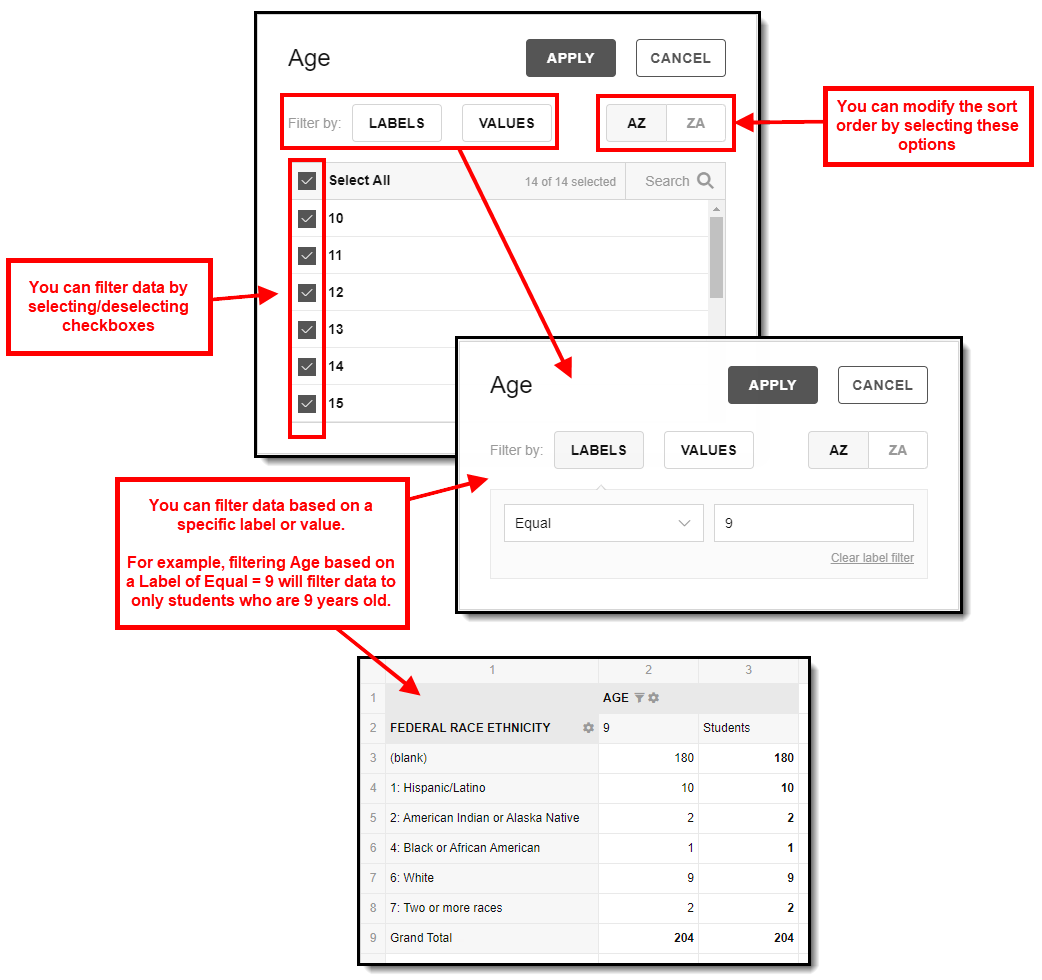 Example of Filtering a Dimension
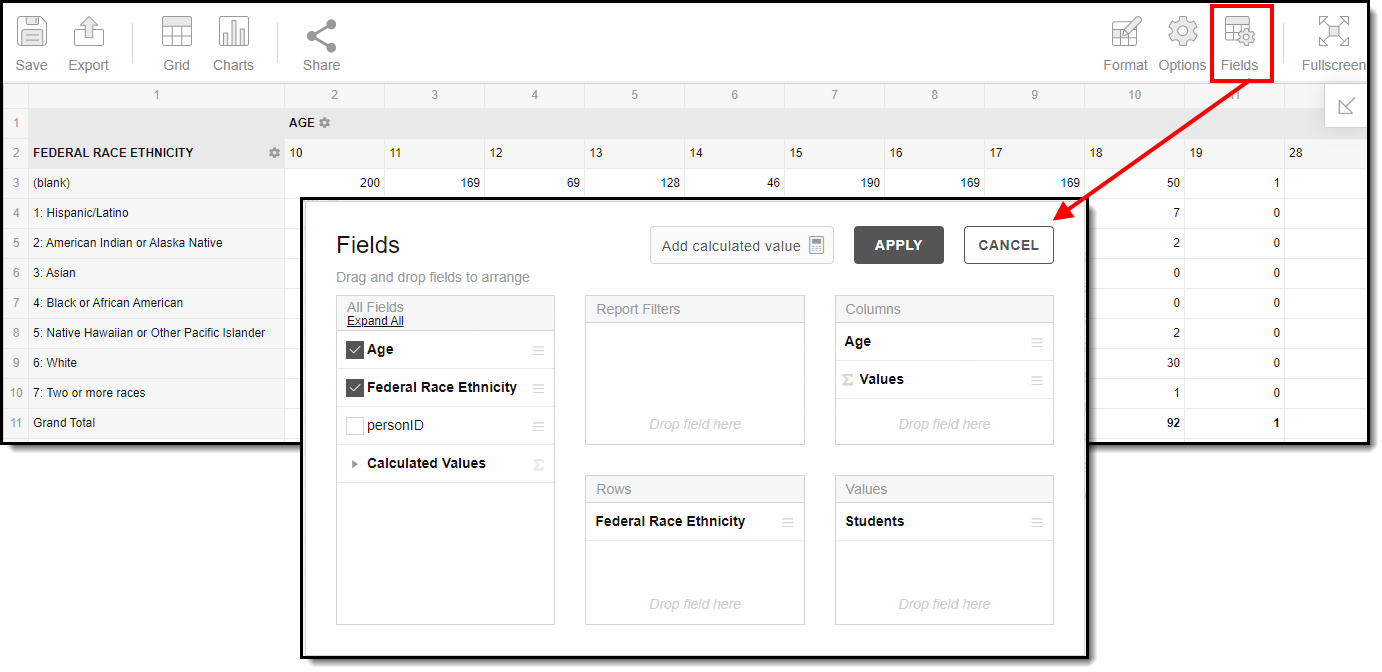 Modify Field Options
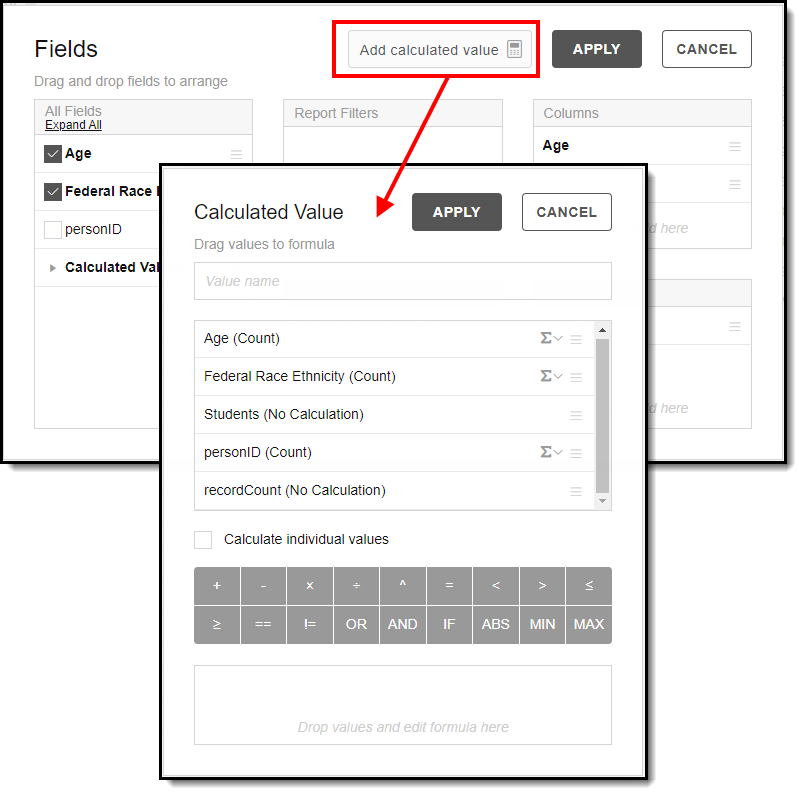 Add a Calculated Value
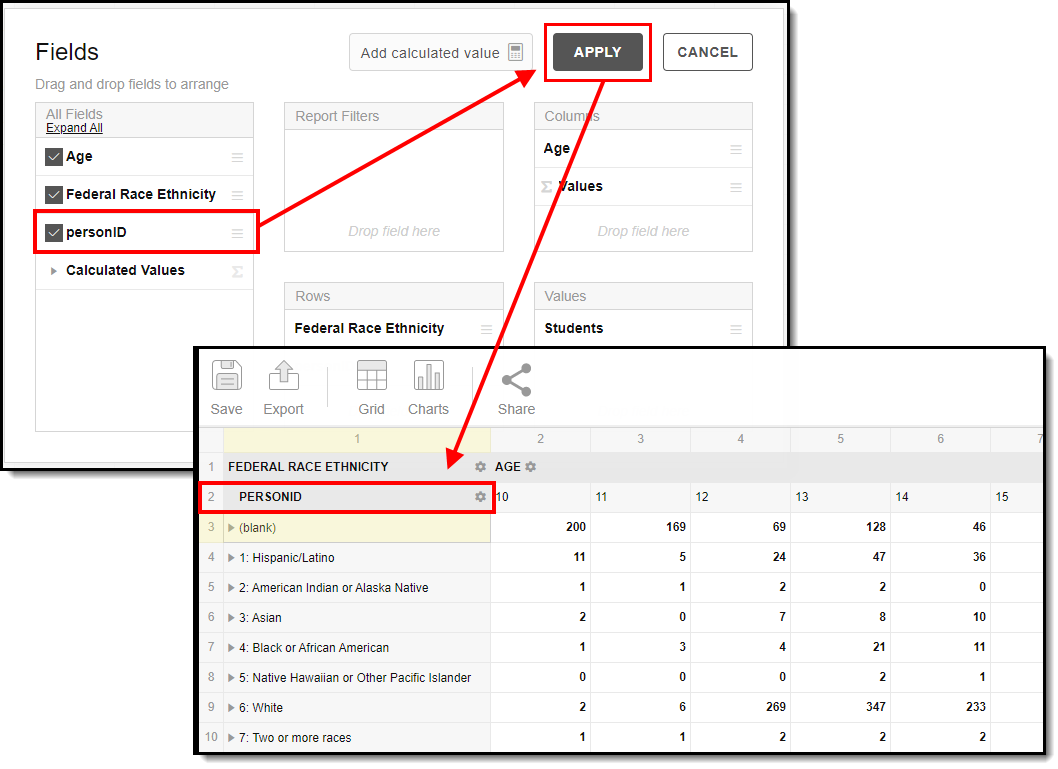 Applying Field Options
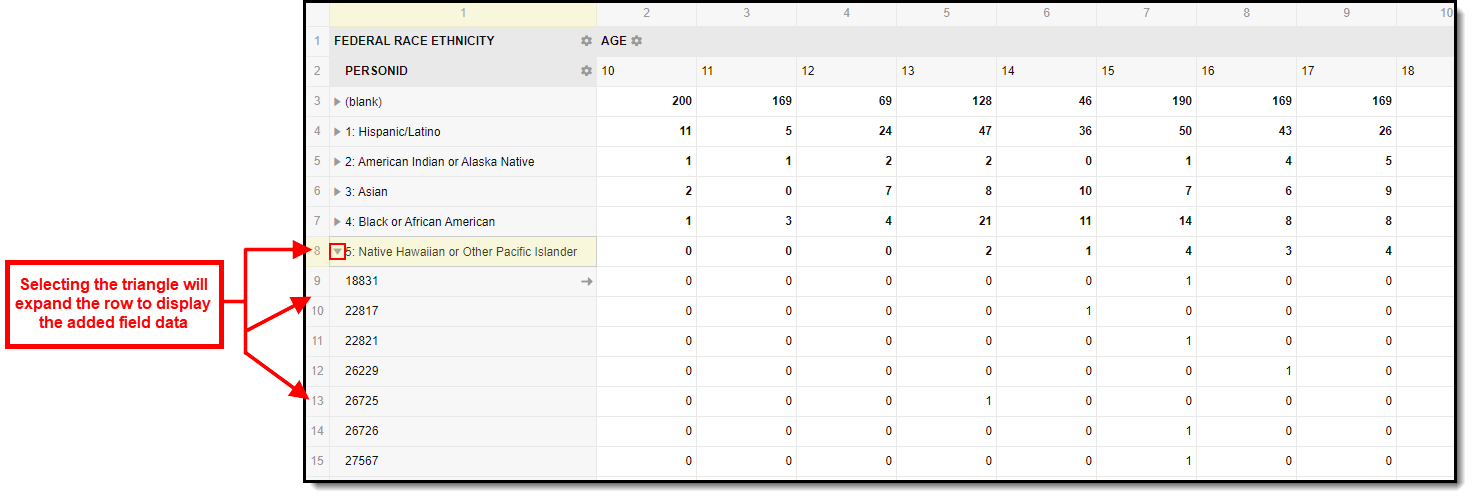 Drilling Down Dimension Data
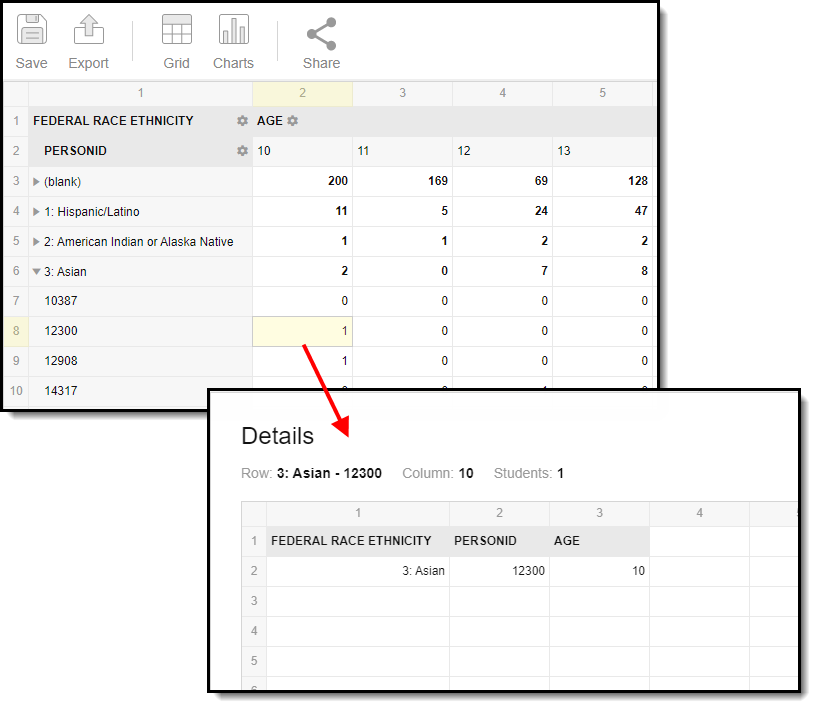 Reviewing Cell Data
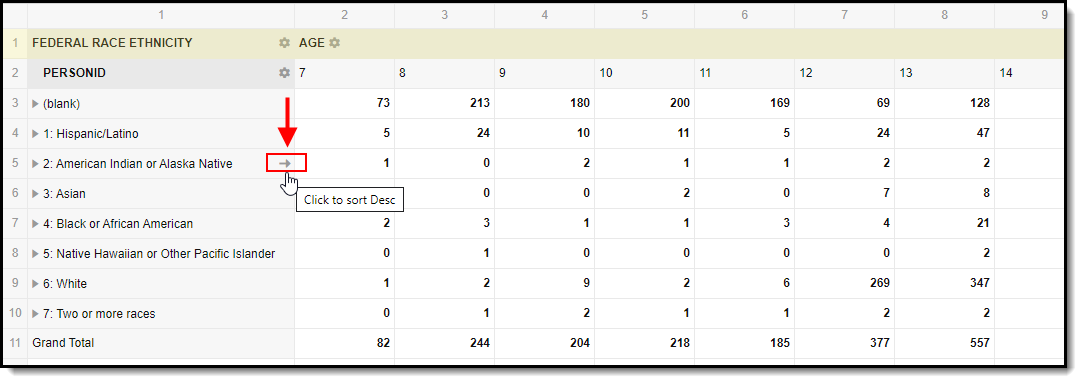 Selecting Row Sort Order
 Right-Clicking a Cell
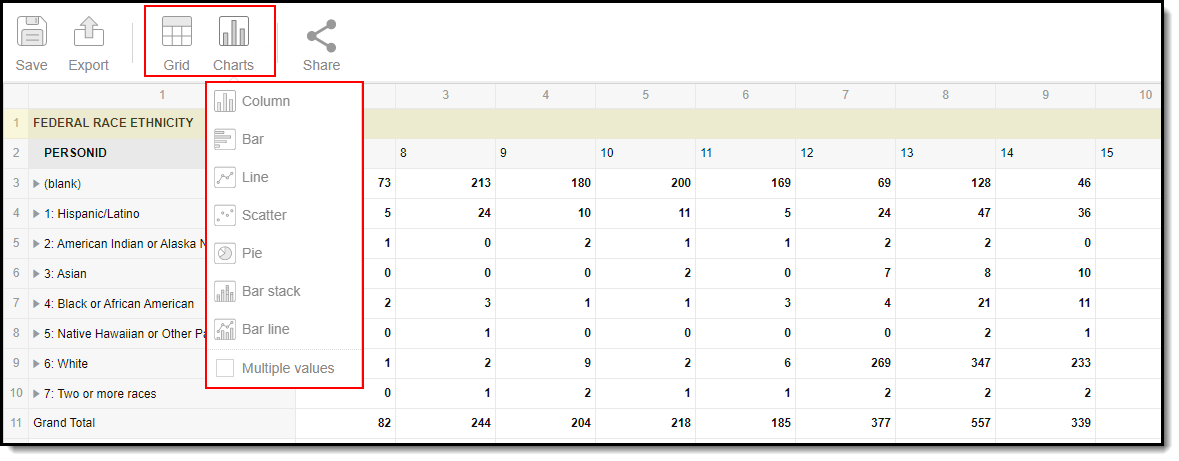 Chart Options
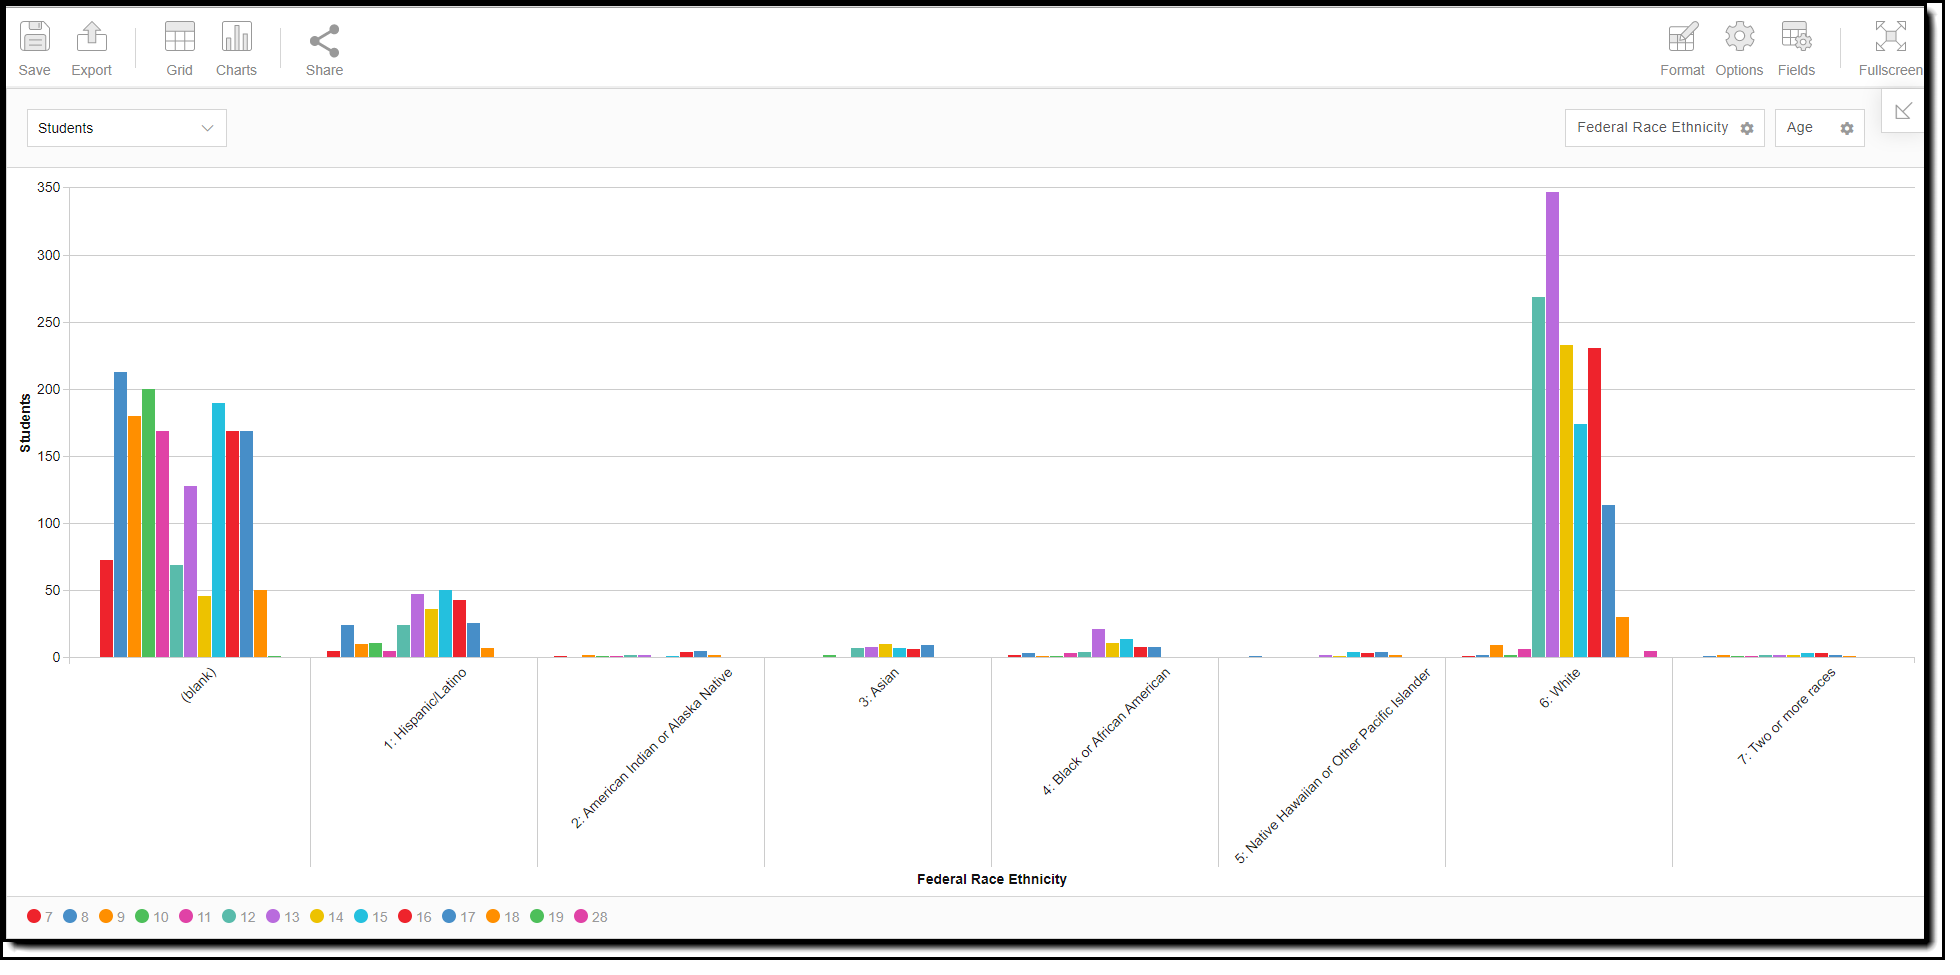 Column Example
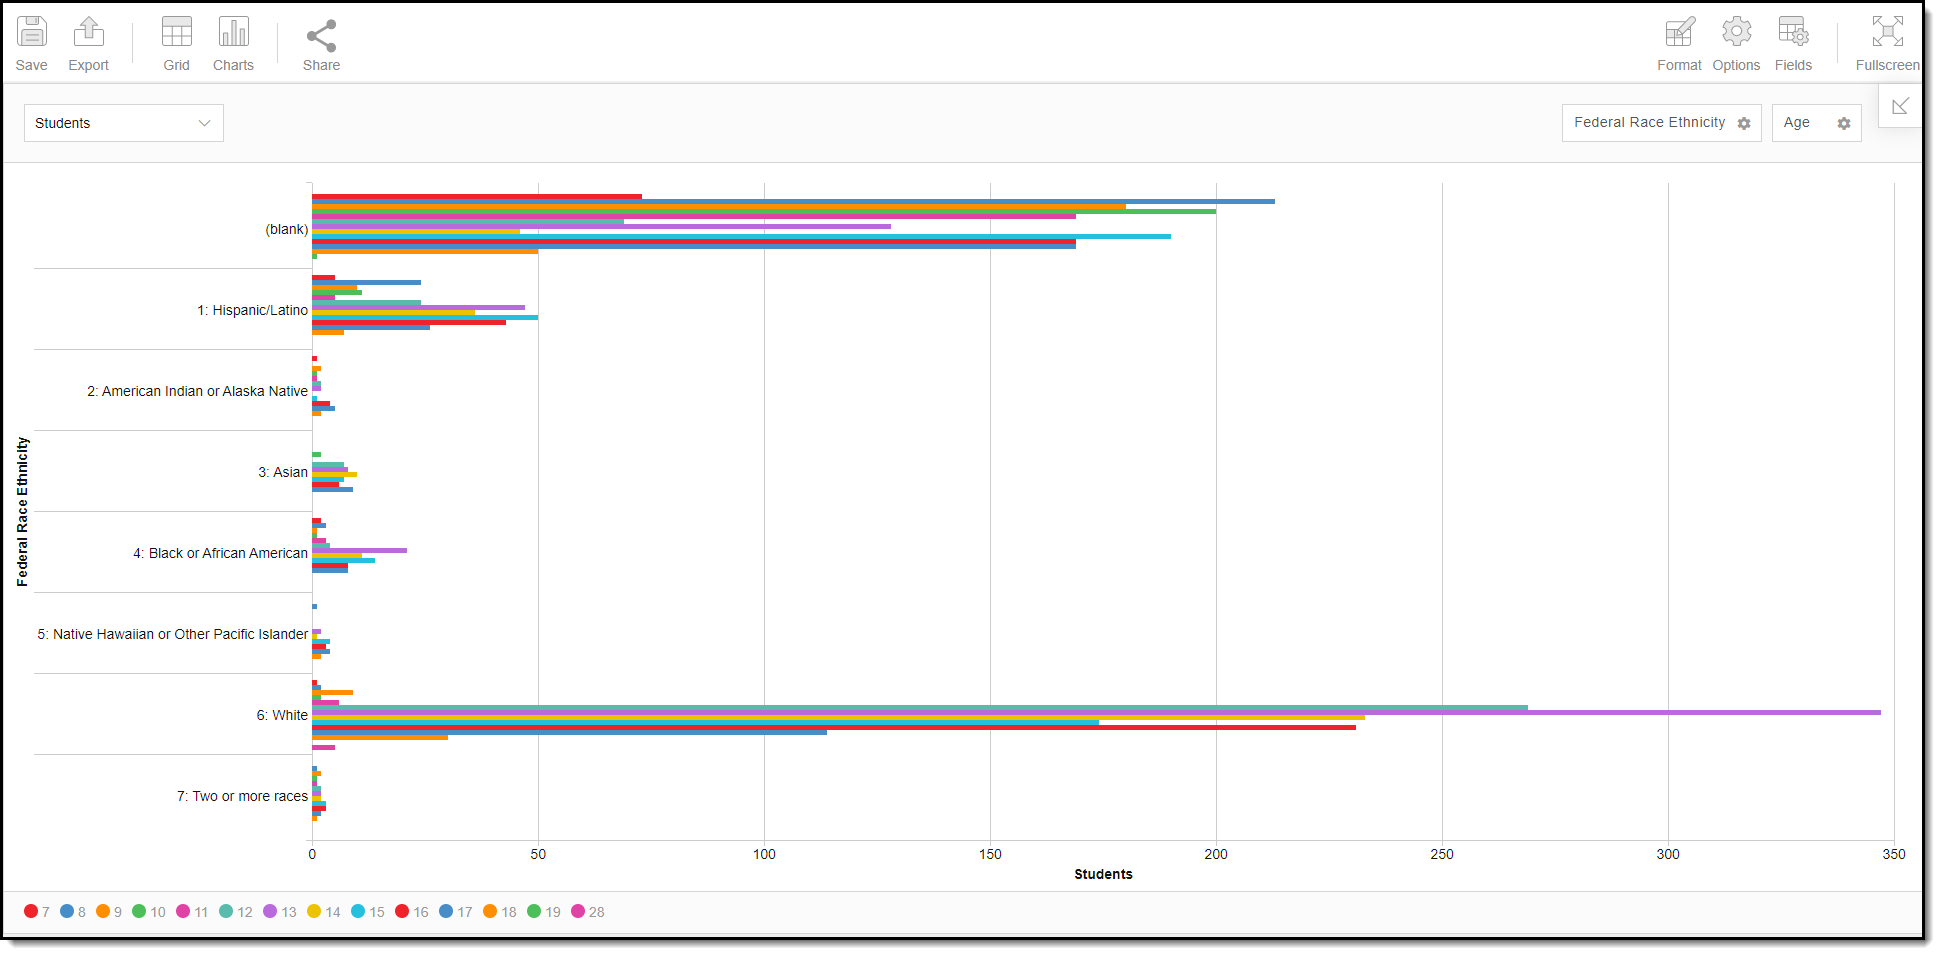 Bar Example
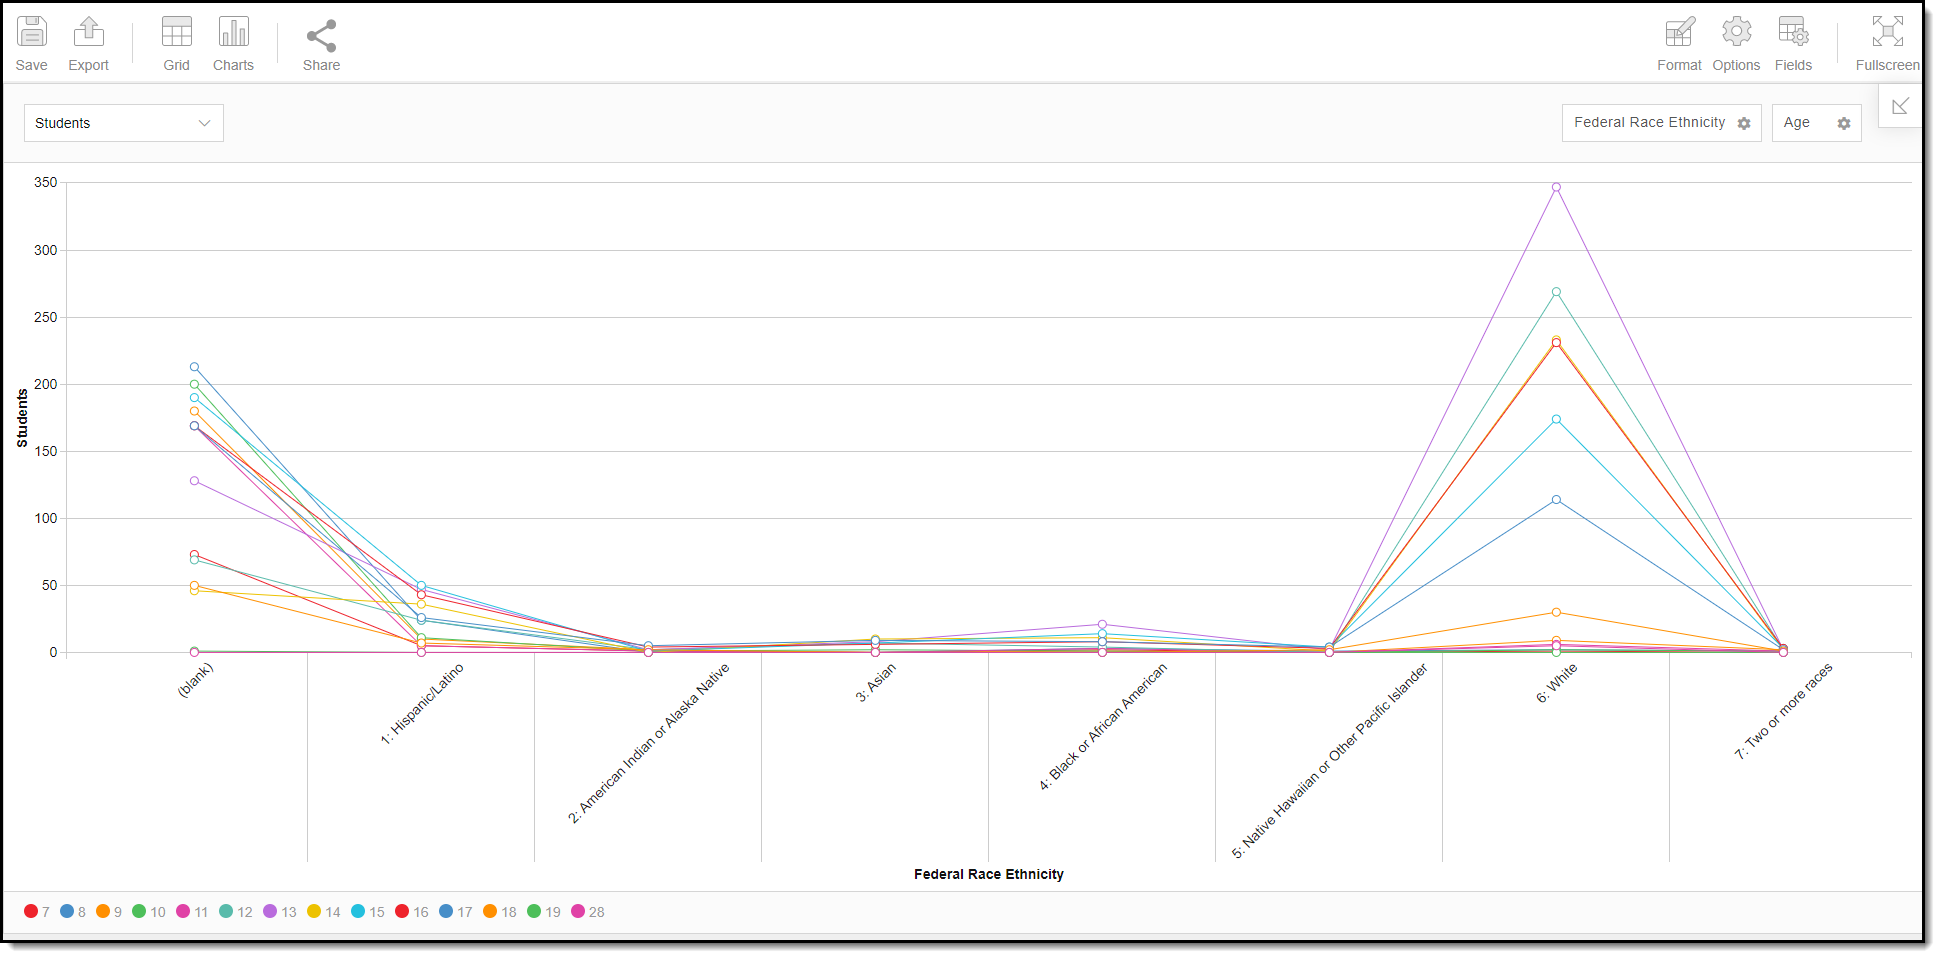 Line Graph Example
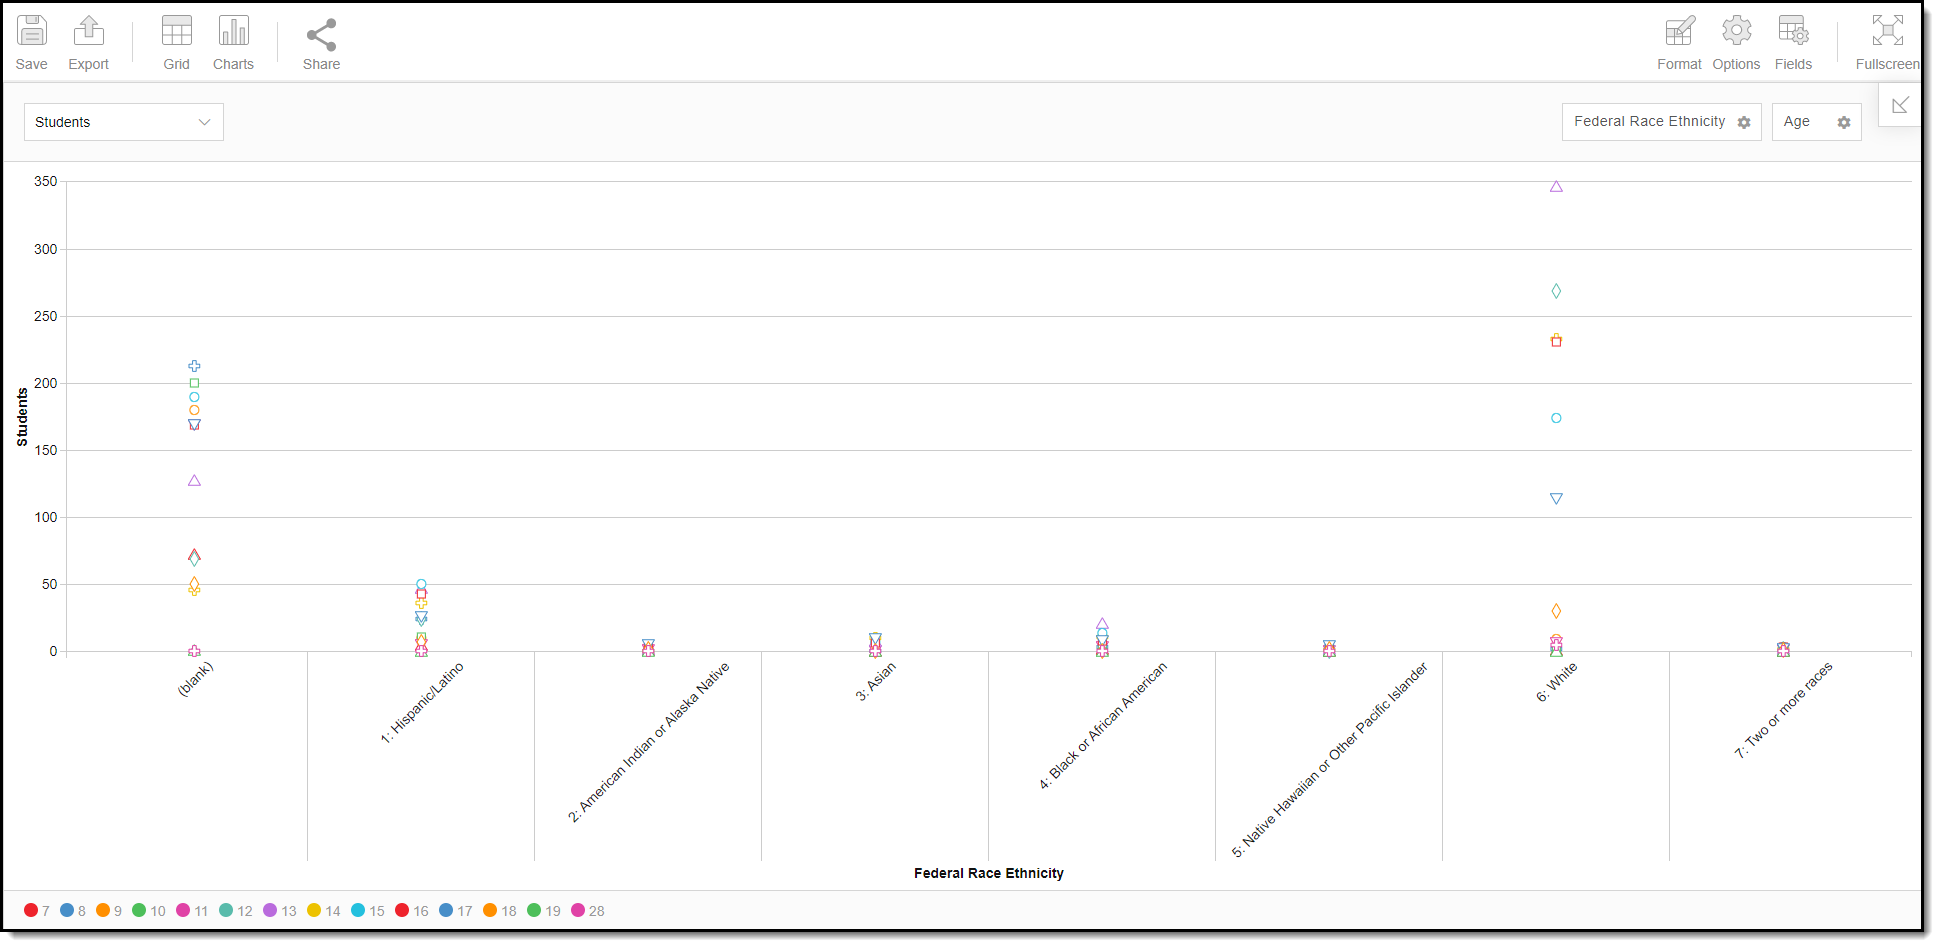 Scatter Chart Example
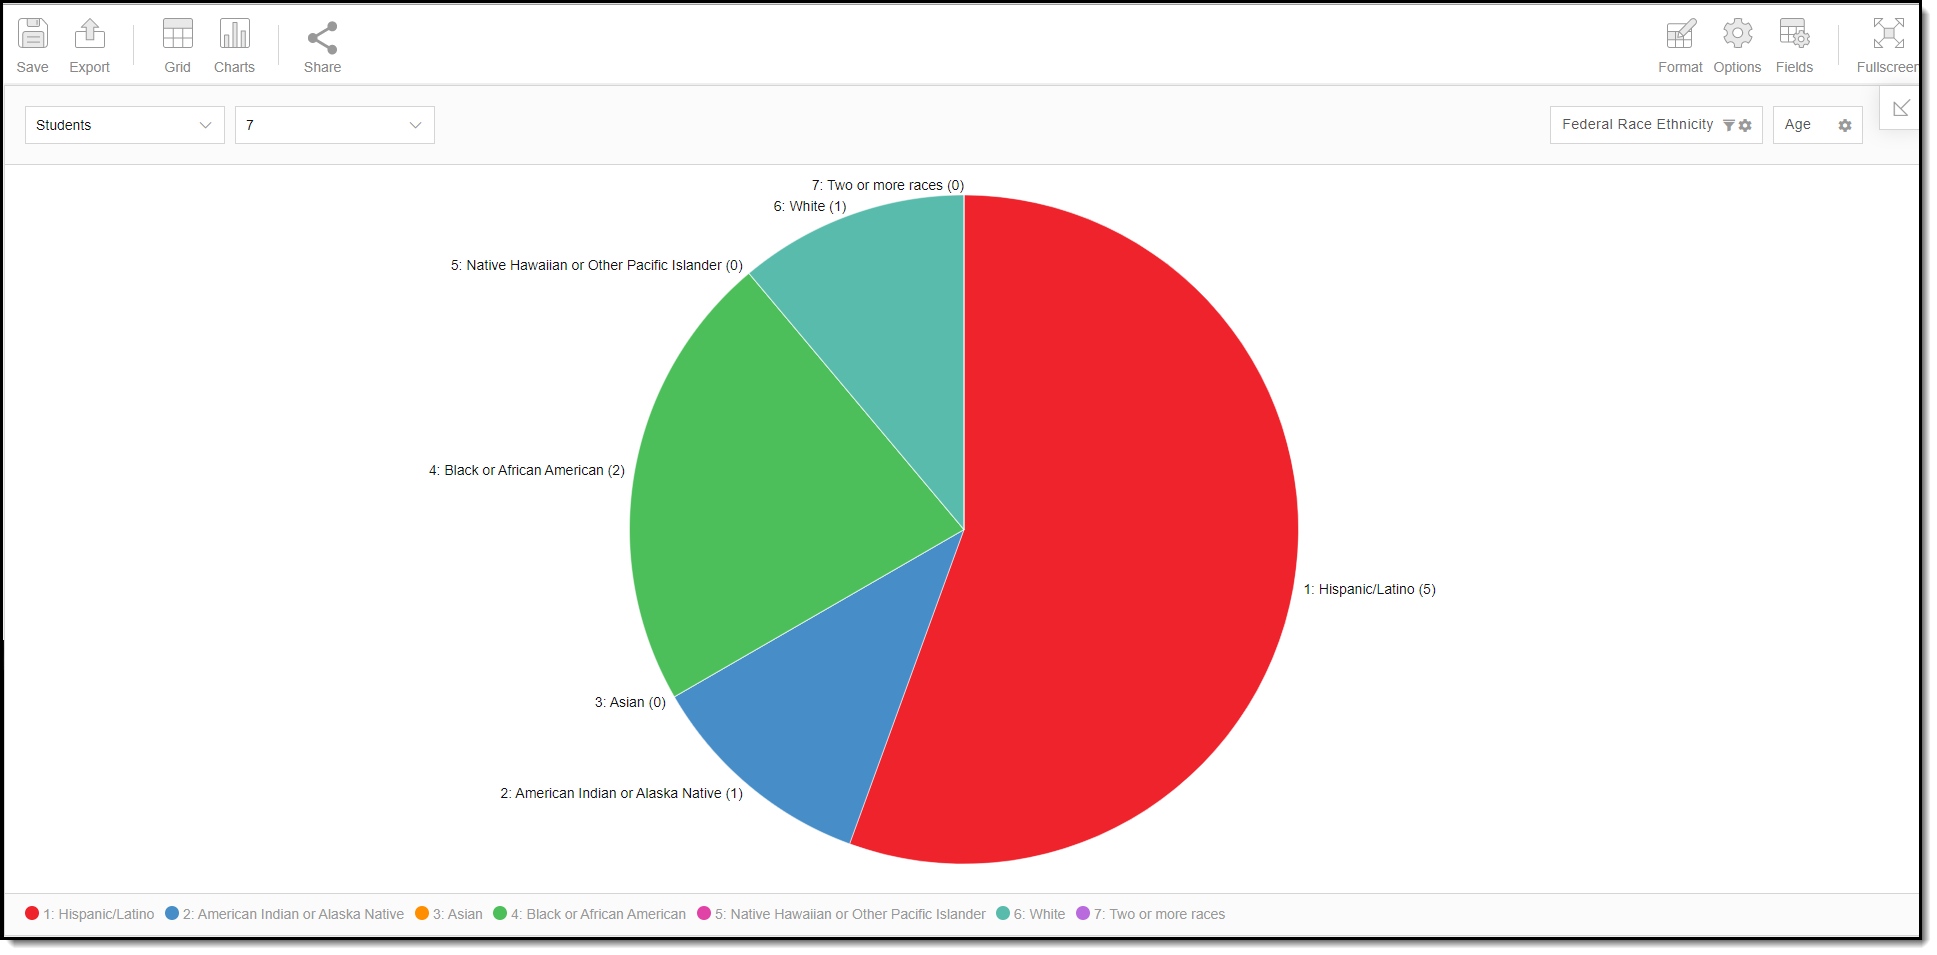 Pie Chart Example
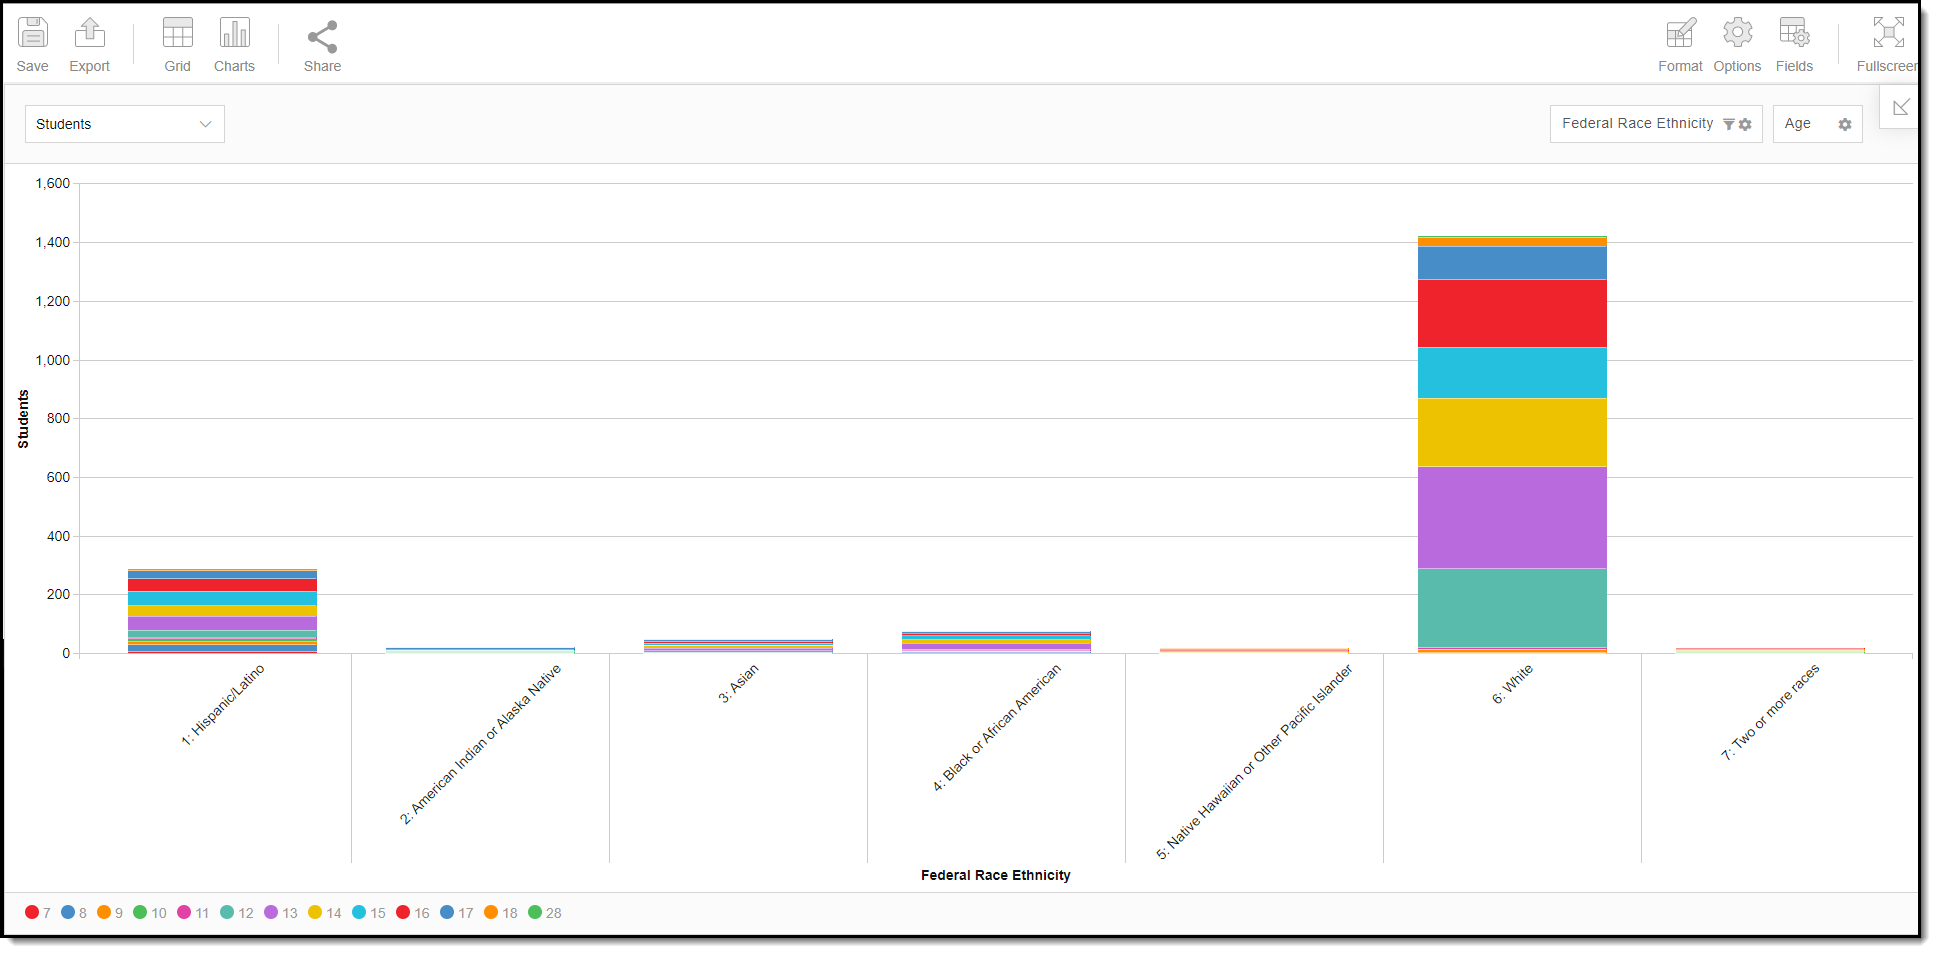 Bar Stack Example
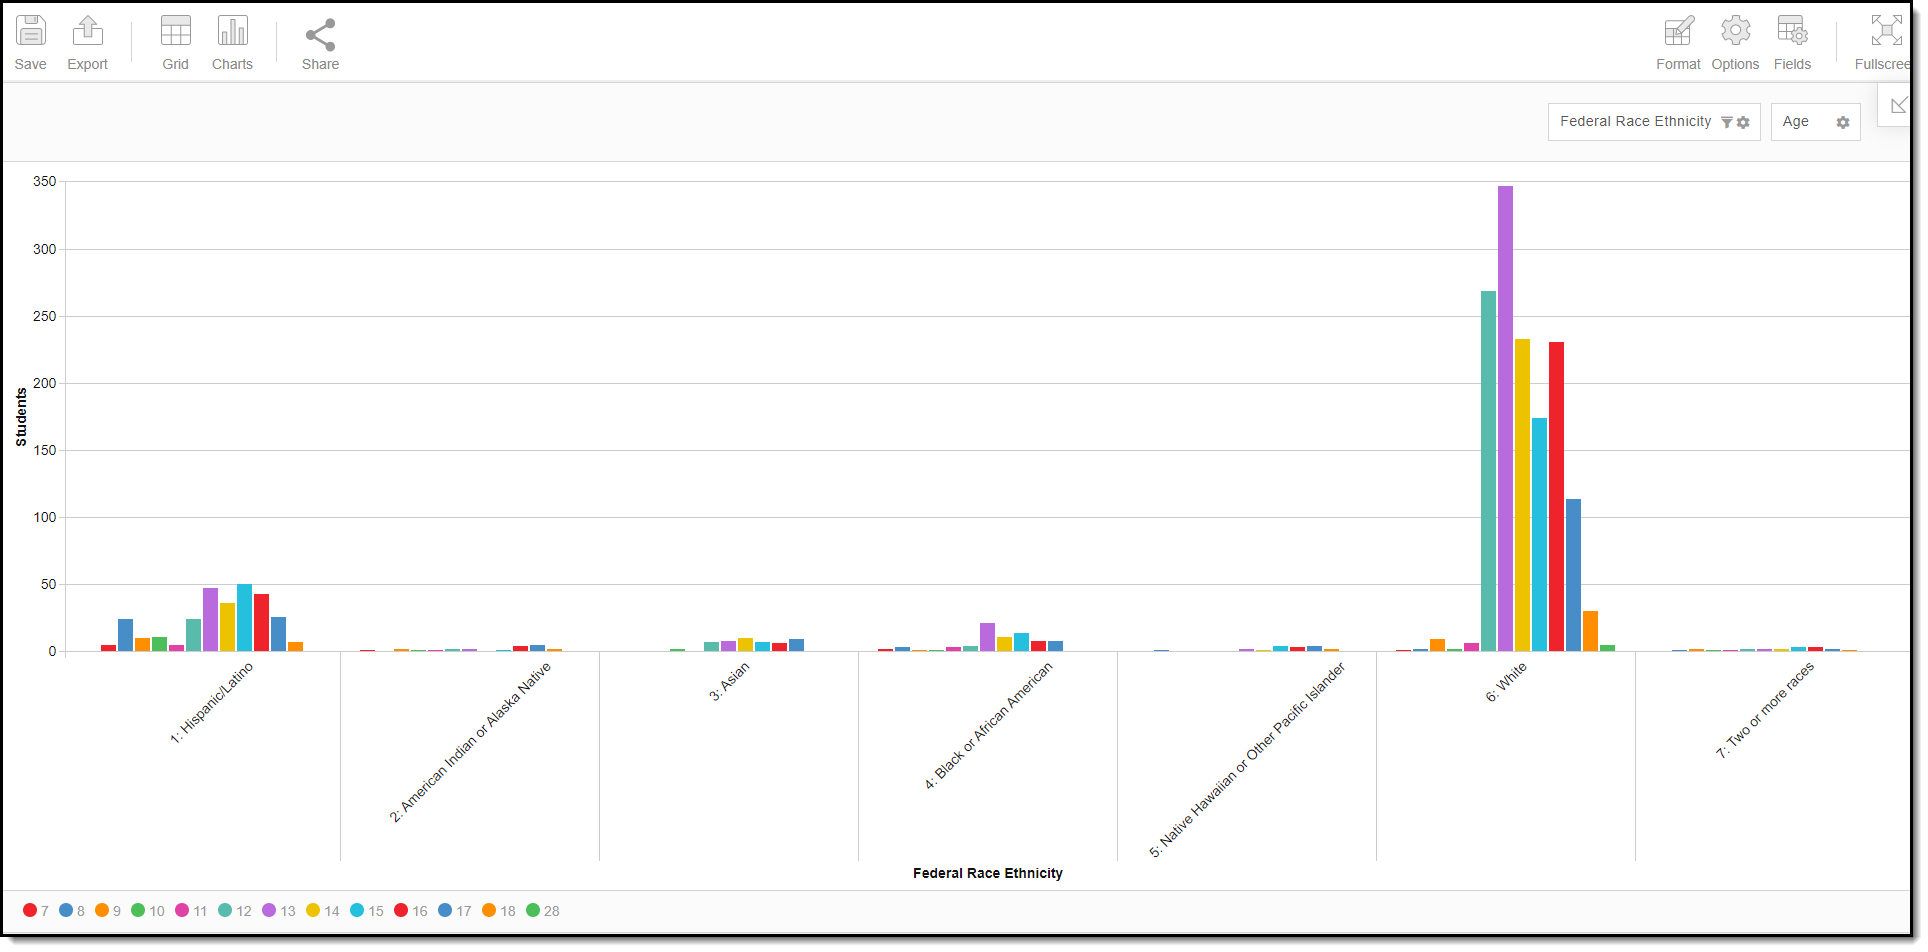 Bar Line Example
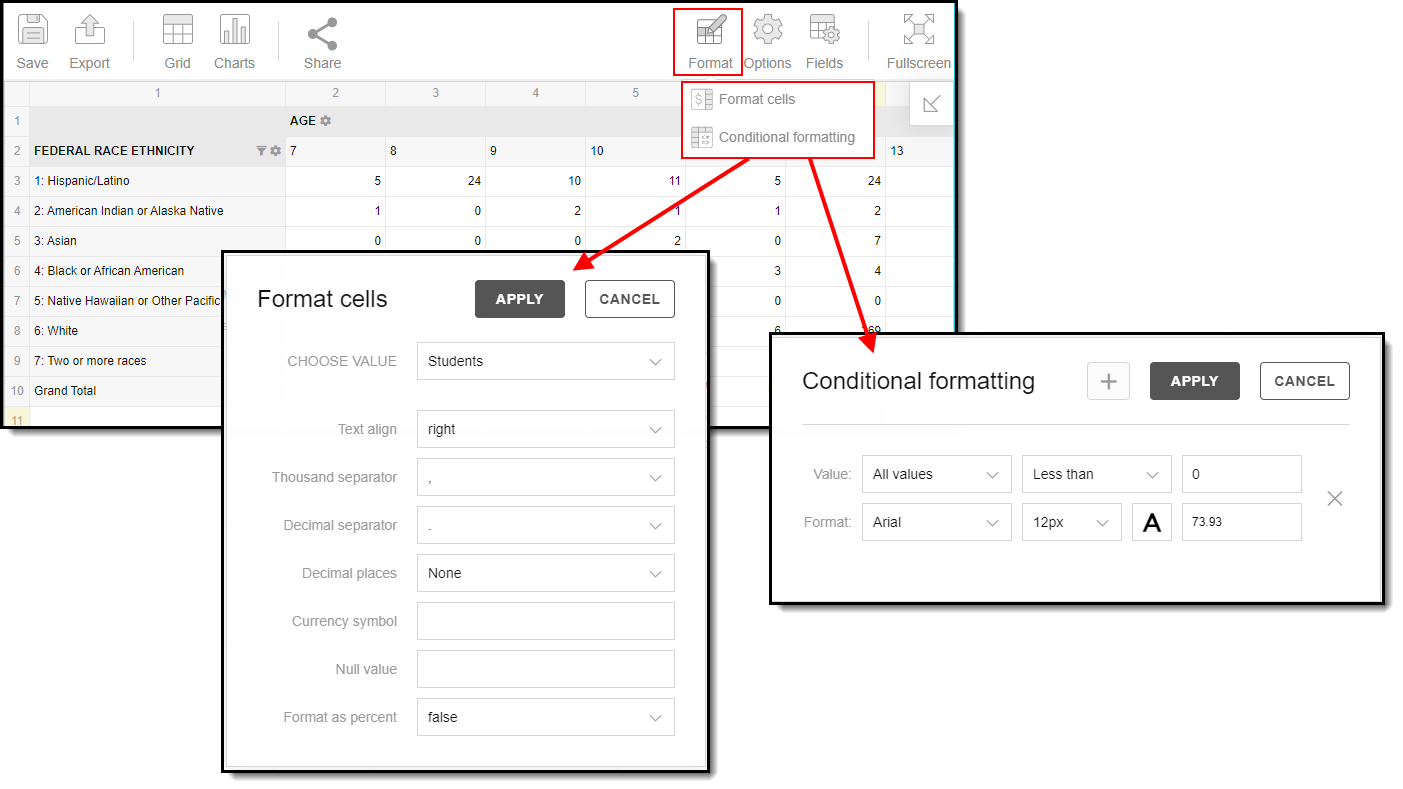 Format Cells and Conditional Formatting
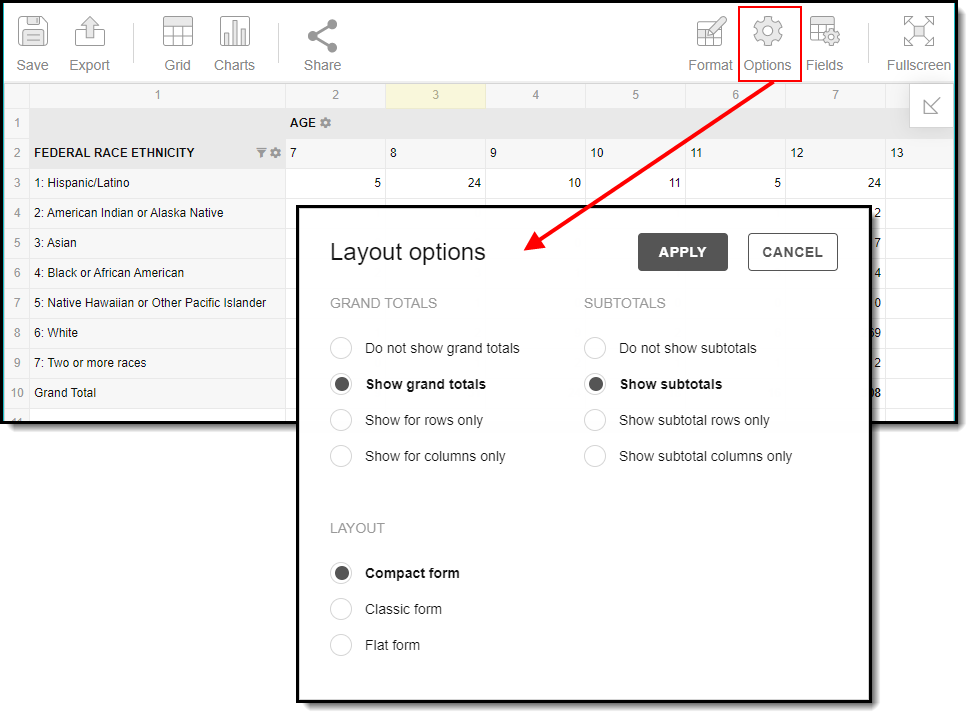 Layout Options
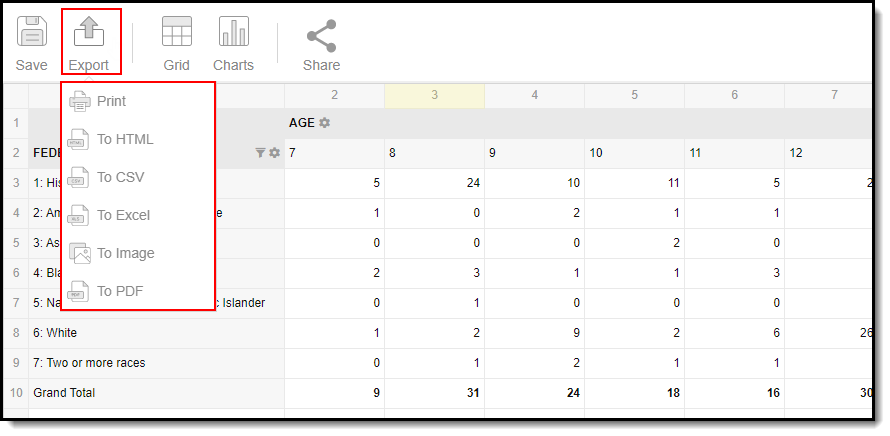 Exporting a Pivot Table
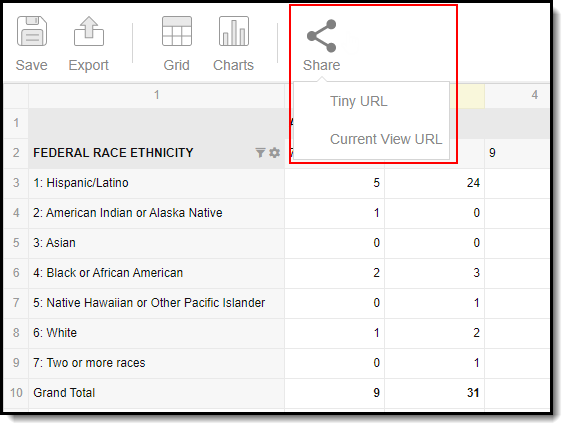 Sharing a Pivot Table
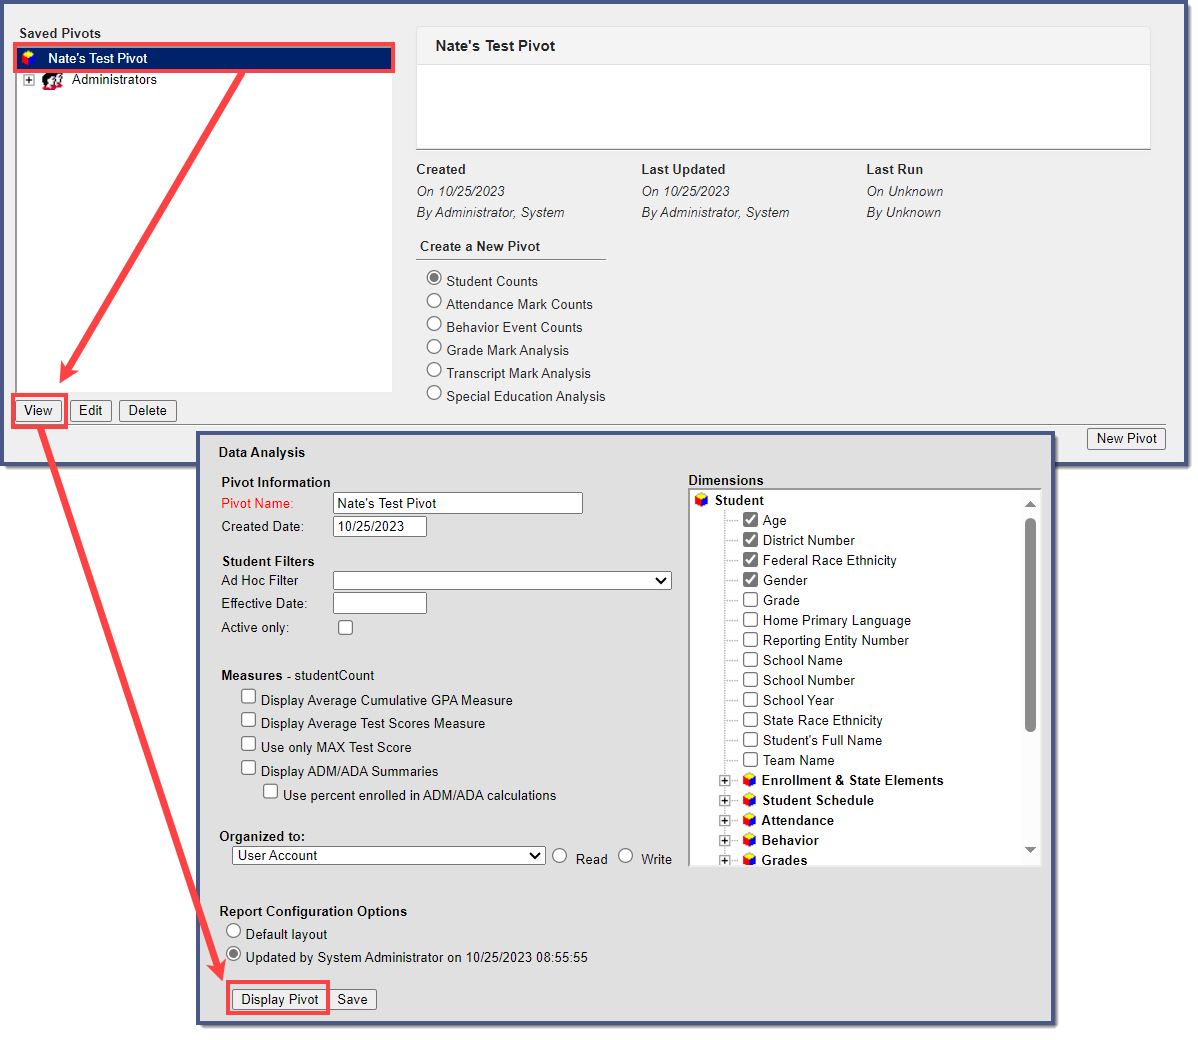 Viewing an Existing Pivot
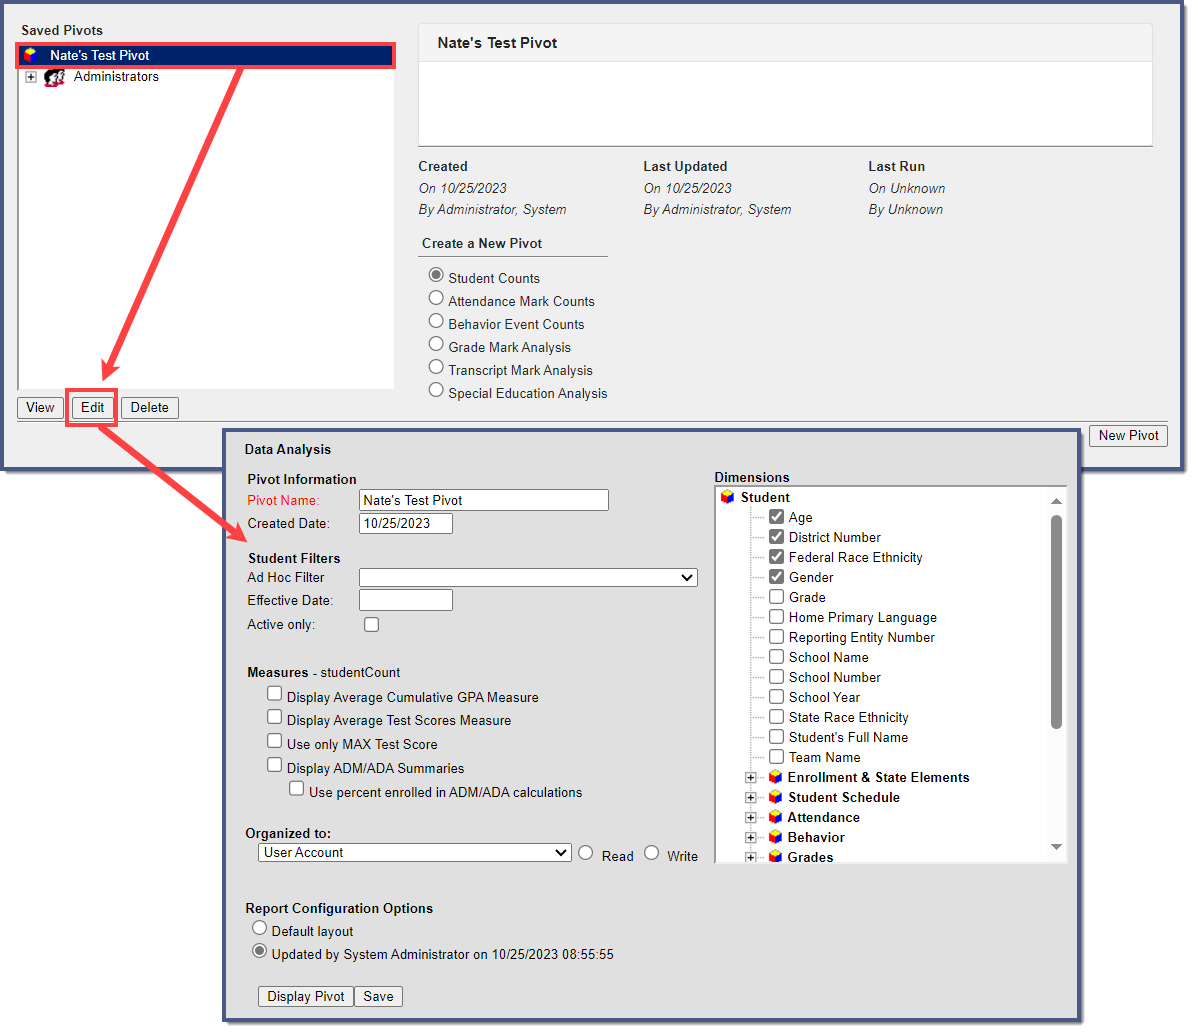 Editing an Existing Pivot
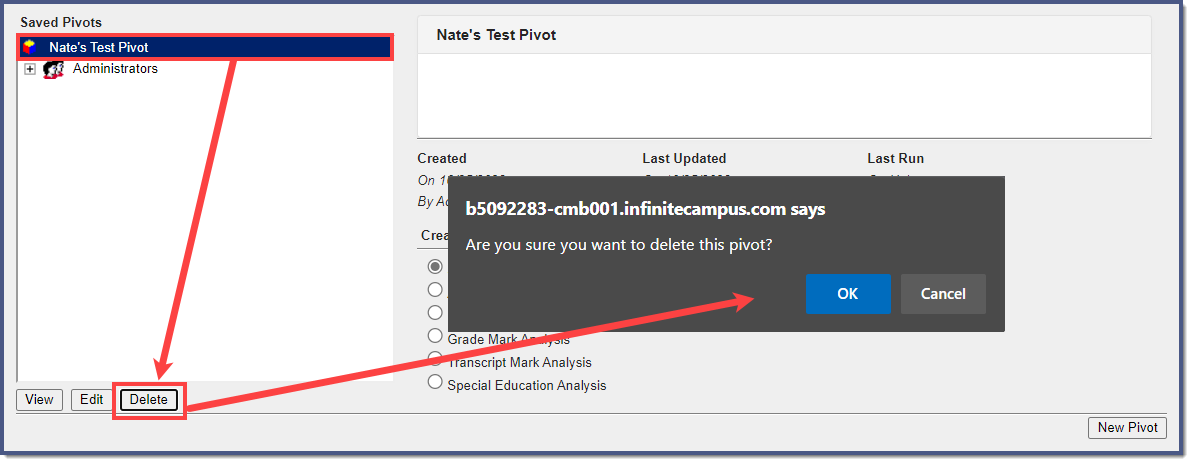 Deleting a Pivot