Early Warning provides school administrators, counselors, principals, etc., with a dashboard to quickly see a student's persistence toward graduation (successful completion of high school) and the likelihood of being promoted to the next grade level. School personnel can compare one student's likelihood to their peers and more effectively intervene on behalf of a student to increase the probability of promotion. Early Warning can be used with students in grades K-12.
Early Warning data is displayed for the current school year only, as determined by the year marked Active in the School Years editor. That year must be selected in the Campus toolbar. When a future or past school year is selected, a message indicates data cannot be displayed.
 Early Warning
See the Counseling Tool Rights article for information about rights needed to use this tool.
The predictive analysis that Campus employs to generate a student's GRAD score is ever-evolving and constantly updated as new data is entered into Campus. A student's GRAD score includes (but is not limited to) the following categories of data:
|
|
|
|
|
|
|
|
|
|
The following videos provide additional information on Early Warning:
This is a responsive screen, which adjusts to the user's screen resolution. When viewing the Student List, the score columns are reduced into one column, where the desired score can be selected from the dropdown list.
 Reduced Screen Size DisplayEarly Warning learns statistical relationships between educational records and enrollment outcomes. Machine learning uses computers to find evidence-based predictors of student outcomes using a large amount of anonymous data. To estimate a student’s likelihood of a particular enrollment outcome – such as dropping out of school – the computer system compares her record to past records of similar students.
The advantages of a machine learning system for Early Warning include:
- The machine-learned statistical model has better predictive power than heuristics published in dropout prevention literature.
- The student information system can detect changes in educational data faster than staff members can and update GRAD scores accordingly.
Early Warning GRAD Score generation recommends two years of observable SIS data. During a District's first year on the Infinite Campus system, there will be shifts in a student's GRAD score because there is no previous year of data for comparison to accurately assess whether the attendance/behavior/curriculum events are part of a larger pattern. This normalizes as more data is available/entered into the SIS.
Submit feedback for Early Warning by clicking the Feedback button in the bottom right-hand corner. This opens a side panel where you can rate your experience with the Early Warning tool and comment on improvements for our development team. You can also access the Campus Community Early Warning forum topic to exchange ideas with other Early Warning users and Infinite Campus staff.
Early Warning Ad Hoc Filter
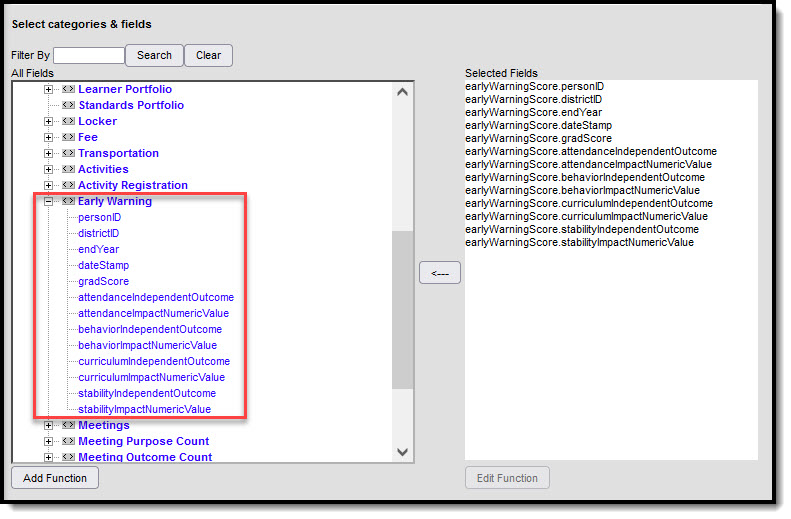
Early Warning information is available in the Filter Designer when creating Student Data Type filters. These fields are located in the Student > Early Warning folder.
 Early Warning Ad Hoc Reporting Fields
Some students may not have Early Warning data when creating filters using the Early Warning fields. To include these students in the filter, select the Demographic fields from the Student > Demographic folder (student.lastName, student.firstName, etc.).
Early Warning Definitions and Calculations
Historical data for all students is used to calculate the scores. The application of that score to different categories and different types of scores varies. The following table lists the definitions and calculations of the terms used in Early Warning.
| Term | Description | Interpretation of Score |
|---|---|---|
| GRAD Score |
The acronym for Graduation-Related Analytical Data represents the score that summarizes a student’s educational record with a single number indicating their likelihood of promotion to the next grade level. It measures factors predictive of dropping out and factors indicative of a student's persistence to the next grade level or graduation.
A GRAD score is not provided for a student when there is no active primary enrollment record on the date the scores were calculated or when the student is new and has too little information available to calculate a GRAD score. |
A GRAD score is between 50 and 150.
A score closer to 150 indicates the student is more likely to be promoted to the next grade level. A score closer to 50 indicates the student has more risk of not being promoted to the next grade level. |
| Category Impact Score |
This score uses all of a student's data. Still, it imputes perfect values into a category subset of columns intended to forecast how much intervention in a category would change the student's GRAD score based on historical data for that student and other students in the same situation. |
An Impact score is between 0 and 100. An Impact Score that is closer to zero requires less intervention. |
| Independent Category Outcome |
This score uses a single category subset of columns of a student's original data (e.g., just the attendance-related columns) intended to explain the GRAD score. It changes predictably as a student's category-related data changes.
Positive behavior events are not included in this count and are not considered by Early Warning calculations.
|
An Independent Category Outcome Score is between 50 and 150.
A score closer to 150 indicates the student is more likely to be promoted to the next grade level; a score closer to 50 indicates the student is less likely to be promoted. |
Score Distribution
The Score Distribution displays the selected school's score distribution for all students on a grid, with students on the left (Y-Axis) and scores across the bottom (X-Axis). The student distribution changes based on the entered tier definitions, selected schools, selected grade levels, and selected Score types.
 Score Distribution DisplayThe score chart is color-coded to show the placement of students corresponding to the entered Tier values. The line placement between each color, indicating High, Medium, and Low, is marked at the breakpoint between the scores.
Use the filter options noted below to narrow the results of the Distribution Chart and the students who returned. Note that the grid and the list of students adjust when changes are made to the filter options.
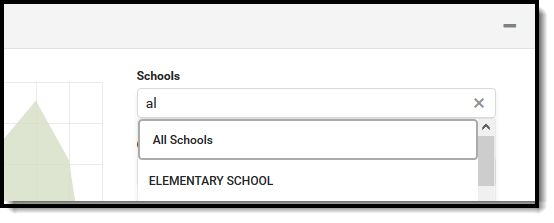
School Selection
Select the schools for which to view Early Warning data by clicking the School field. All schools can be selected, but know that viewing data for all schools in the district at one time may not be beneficial.
Only the schools to which the user is assigned calendar rights are available in this list.
This is a searchable list; begin typing a school's name or scroll through the list. Click the X next to a school's name to remove it from the field.
 School Selection
When selecting a school without scores and then selecting a different school with scores, the distribution filter settings return to the default percentages.
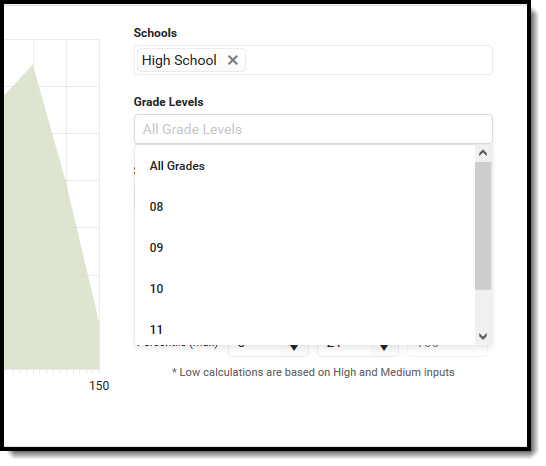
Grade Levels
Choose which grade levels to consider. If multiple high schools are selected, choosing just the 12th grade may provide more knowledge of how the senior class is doing across the district. Another option is not to select any grade level, which is the same as choosing All Grade Levels.
 Grade Level Selection
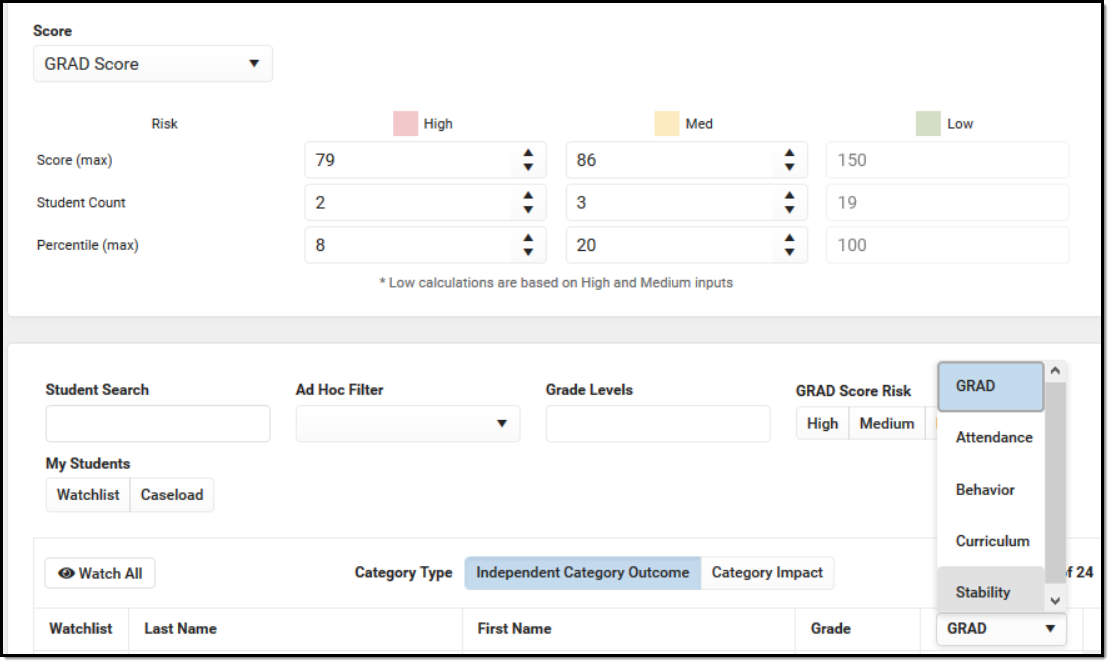
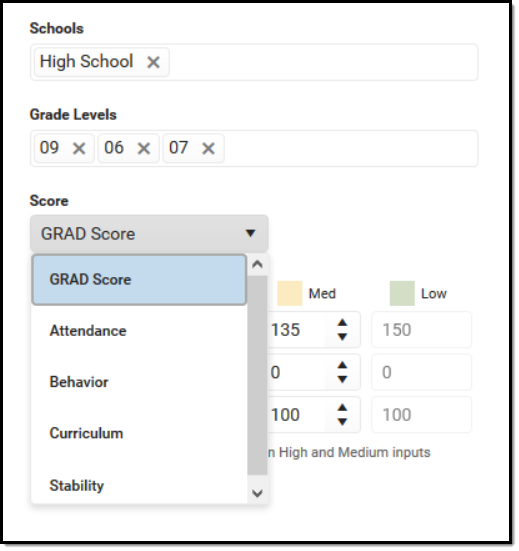
Score Types
The score types include but are not limited to the following definitions. Only one score type can be selected at a time. When a specific score type is selected, the list of students refreshes and displays results and color-coding based on that selected type.
Changing the values for the score, student count, percentage, and risk levels changes the list of students.
| Score Type | Definition |
|---|---|
| GRAD Score |
GRAD Score considers a student's education records and how likely it is the student will complete the current grade level and promote to the next grade level. This calculation takes into account the student's Attendance, Behavior, Curriculum, and Stability information in one overall score.
|
| Attendance | This score looks at features related to the student's Attendance Data, such as Absences, Tardies, Total Attendance Percentage, Chronic Absenteeism Level. |
| Behavior | The Behavior score looks at features related to the student's Behavior Data, such as Behavior Incidents, Out-of-School Suspensions, In-School Suspensions. |
| Curriculum | This score looks at features related to the student's Transcripted and in-Progress Grades, such as Transcript Credits Earned, Transcript Edits Attempted but not Earned, Current In-Progress Grades, and Assignment Scores. |
| Stability | The stability score looks at features related to the student's Census Data, such as total number of years the student has been enrolled at the selected school, length of time the student has been enrolled in the district, how long the student has lived at their current address, the student's overall number of addresses, the enrollment status, and the number of portal logins. |
 Score Selection
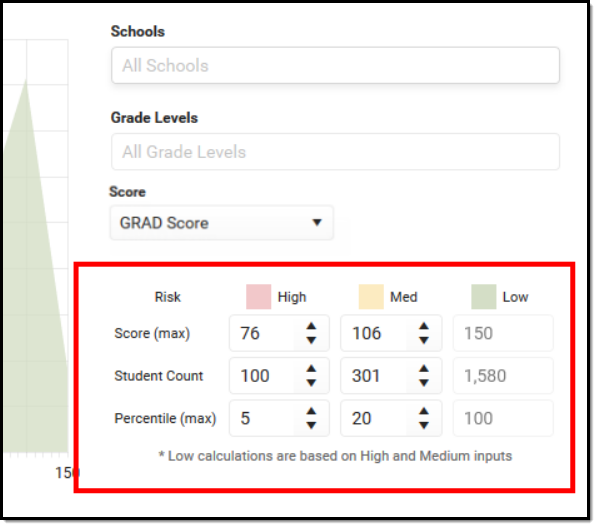
Tier Definitions
Enter the desired values for Score, Student Count, and Percentile for each High, Medium, and Low threshold. You can modify the percentile values by typing in the fields or using the up/down arrows. The tier settings return to the default values when the tool is refreshed.
- A value closer to 50 indicates the student is at a higher risk for non-promotion and is displayed in red.
- A value closer to 150 is at a lower risk of non-promotion and is displayed in green.
- A value that falls between 50 and 150 tier definition boundary lines indicates the student is at medium risk for non-promotion and is displayed in yellow.
Or, use the default entries, which are a maximum percentile of 5% of the student population (high, more risk), 21% of the student population (medium, moderate risk), and 100% of the student population (low, less risk).
Intervention in some areas may benefit some students who have a high-risk score in a certain category, while other students may not benefit from such programs. Certain events may have caused a change in a student's score, and an intervention may not be the best way to affect change for that student (natural disasters, etc.).
When one score is changed for one of the tier definitions, every value adjusts accordingly. For example, when a counselor is viewing the 12th-grade students at the high school and changes the Score values from 50, 100, and 150 to 76, 110, and 150, the student count changes to match the entered Score values, as does the Percentile values.
If the entered values do not match the results, data is overridden to list the students that do match the entered values. For example, if ten students have a GRAD score of 50, and 20 students have a GRAD score of 55, and the Student Count is set at 15, the ten students with a GRAD score of 50 are listed.
 Tier Definitions Entry
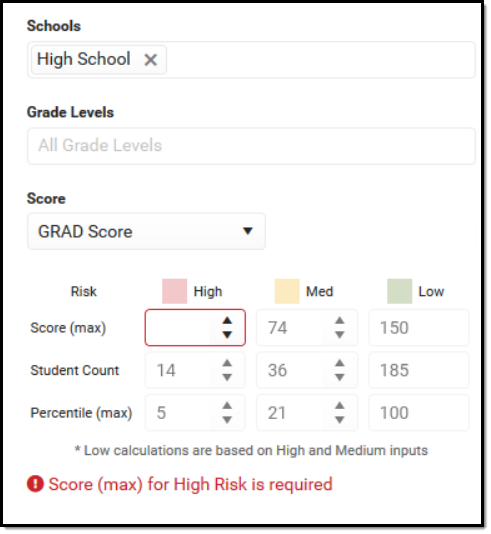
Only whole numbers can be entered. If no value is entered, the box turns red, and a warning message indicates that a value for that field is required.
 Score Entry Missing
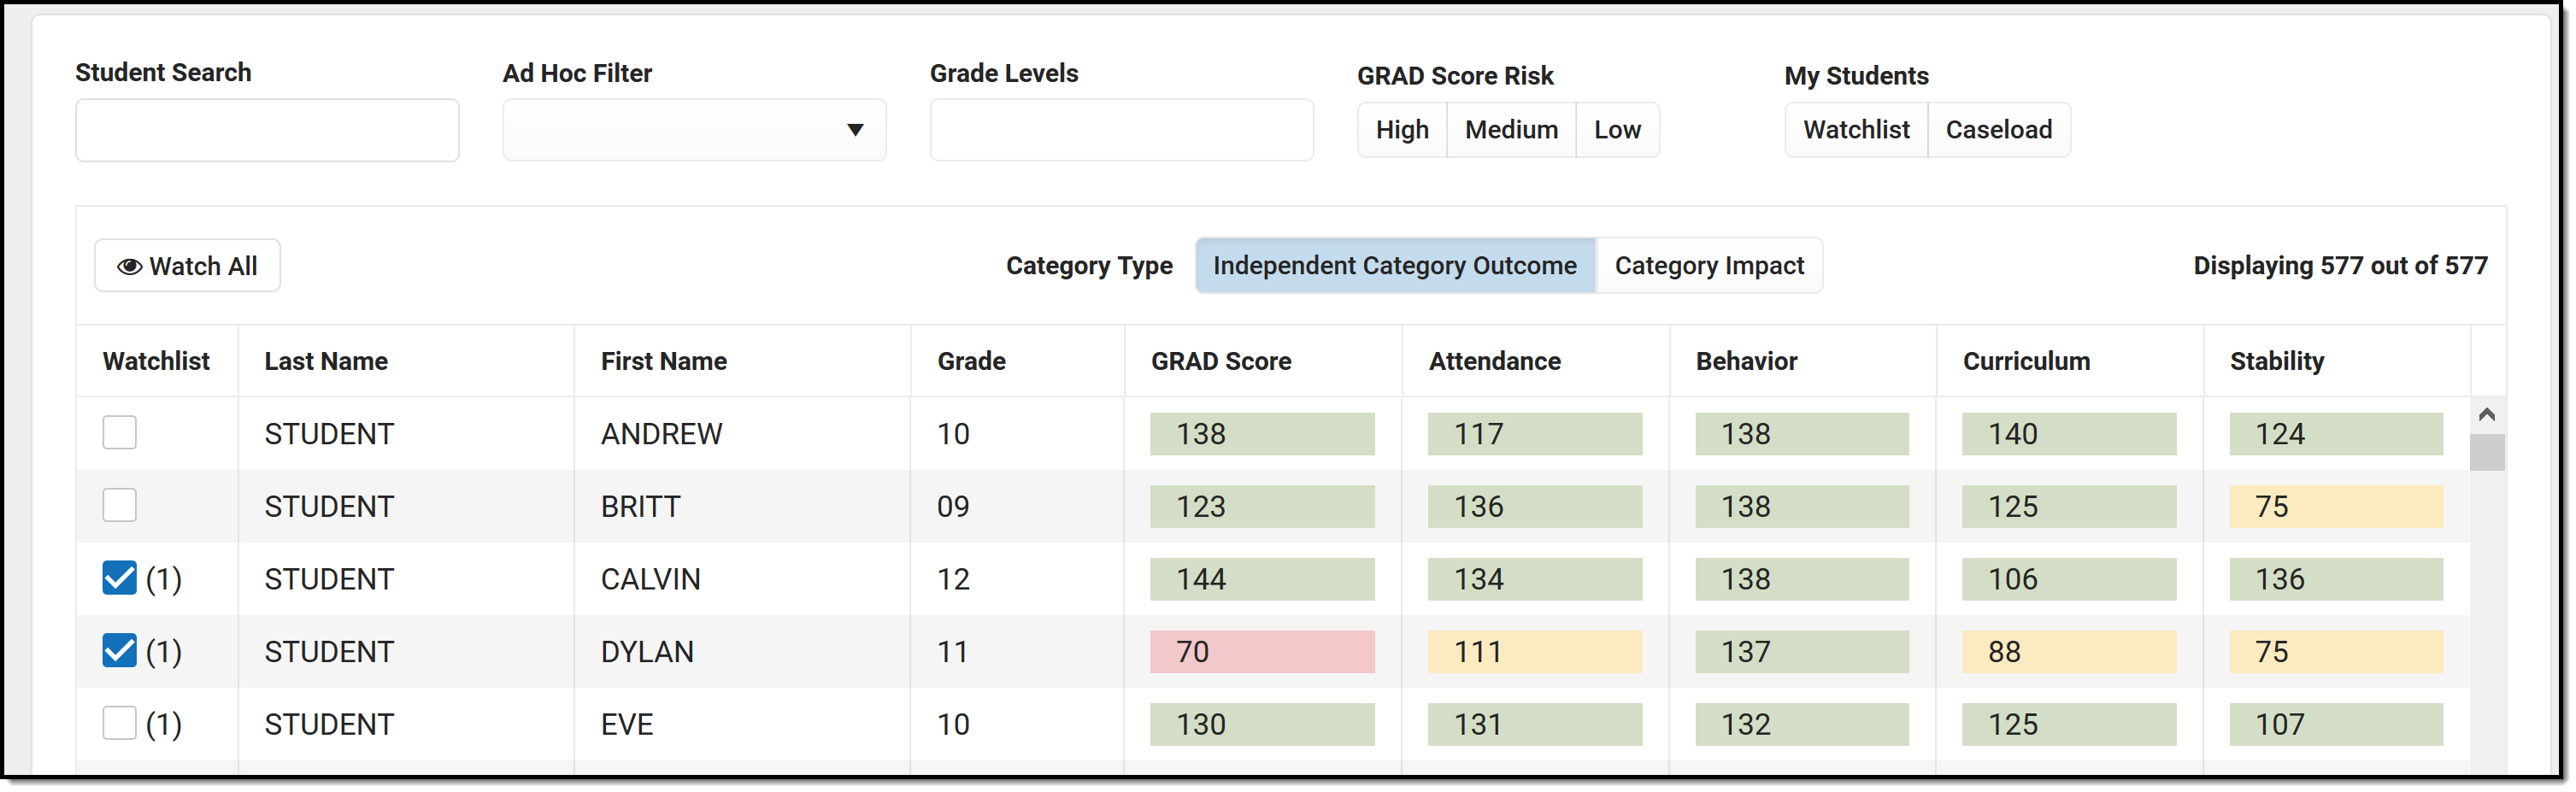
Student List
Based on the selected school(s), grade level(s), and entered scores, students matching those values are listed in the Student List section. Additional filters can be entered, like a pre-existing ad hoc filter, grade level, or a specific student. The default sort is alphabetical by last name. Click the column headers to re-sort the list of students.
 Early Warning Student List
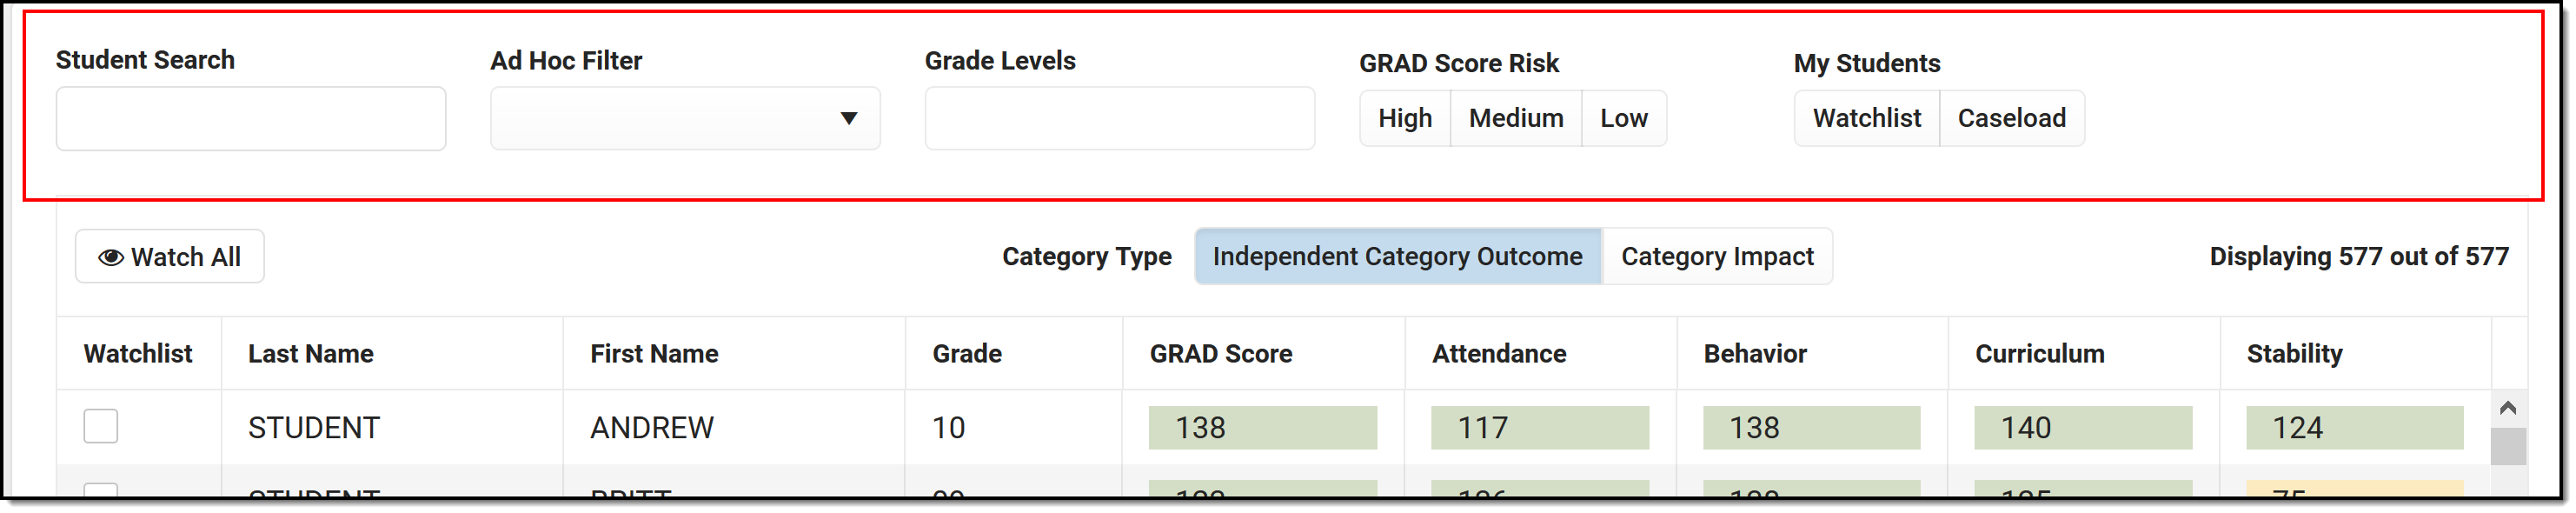
Filter Criteria
The following can be entered to narrow the students' results further so counselors and administrators can focus on a smaller group of students who may need intervention.
| Field | Description |
|---|---|
| Student Search | Enter part of a last name or first name to display only specific students. This field searches as the user types, and results change as more information is entered. |
| Ad hoc Filter | Select a saved ad hoc filter from this list. This list of filters only includes those using the Student Data Type (not Census/Staff, not Course/Section). Users must have tool rights to Ad hoc Reporting and the selected filter. |
| Grade Levels | Select the grade levels from the list. Multiple grades can be selected, and only those grade levels included in the Schools selected on the Score Distribution card are included. If only the High School calendar is selected, only those grade levels are available for selection. |
| GRAD Score Risk | All GRAD Score Risk levels (High, Medium, Low) can be displayed. To see only those at a High risk of non-promotion, select High. All risks can be selected, but this returns the same list with no other filters selected. |
| My Students |
Staff can choose the students in their Caseload, which returns any student on their caseload (where they are assigned any Team Member Role or Plan Type).
This list can also be set only to show those students who have been marked as Watchlist. This is done by marking the Watchlist column in the list of students or if the Add to Watchlist button is marked on the Student Detail. |
 Filtered Display
Student Display Options
When the list of students is filtered to the desired point, staff can choose to monitor those student scores. Marking students on a watchlist allows counselors to focus on particular students. Perhaps a watchlist includes all of the students the counselor is assigned, those who have behavior issues, or a list of students who may have social issues. Watching those students can provide the counselor with trends or thoughts on assisting that student during the school year.
- Mark the Watch All button. This places a checkbox in the Watchlist column for all students listed. You can also add an individual student when viewing Student Detail.
- Change the display from Independent Category Outcome to Category Impact. GRAD Score only displays numeric values, and only one category type is displayed at a time. Category Impact shows the list's High, Medium, or Low value and a numeric representation of how a focused intervention in a certain category could change the GRAD Score.
- A total count of students is listed to the right, indicating how many students are currently listed (after filters are applied) out of how many total students.
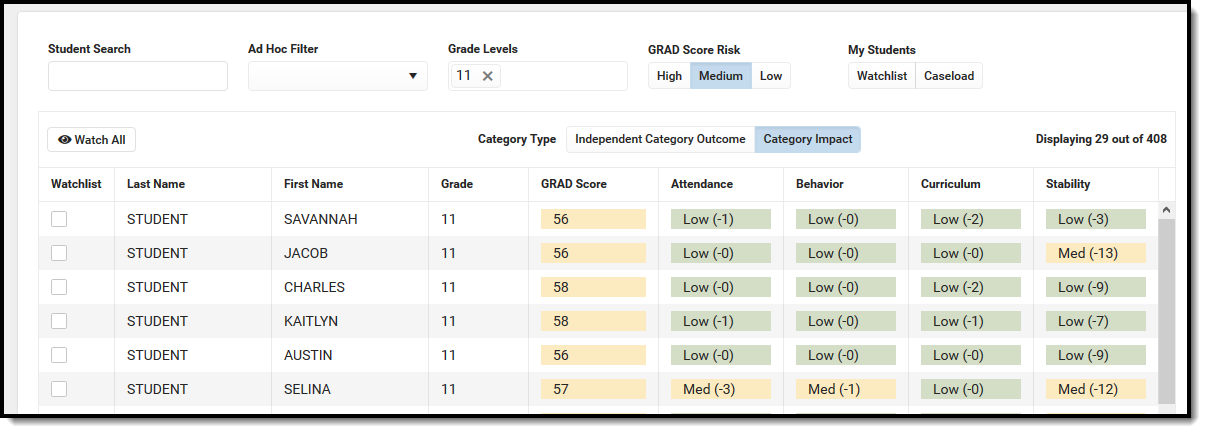
In the image below, the 11th grade is selected in the Grade Levels, along with those 11th-grade students who have a Medium level of risk, and the Category Impact option is chosen. 29 students match those options. With these results, you can mark the Watch All button to add those students to your Watchlist or further narrow the results.
Filtered Display
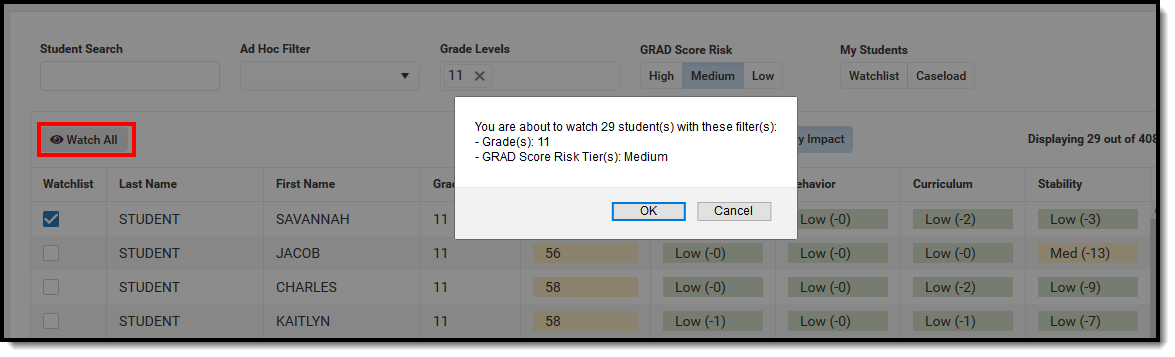
When clicking the Watch All button, a validation message verifies this action. Click OK to continue (students are added to your watchlist) or cancel (students are not added to your watchlist).
 Watch All Students
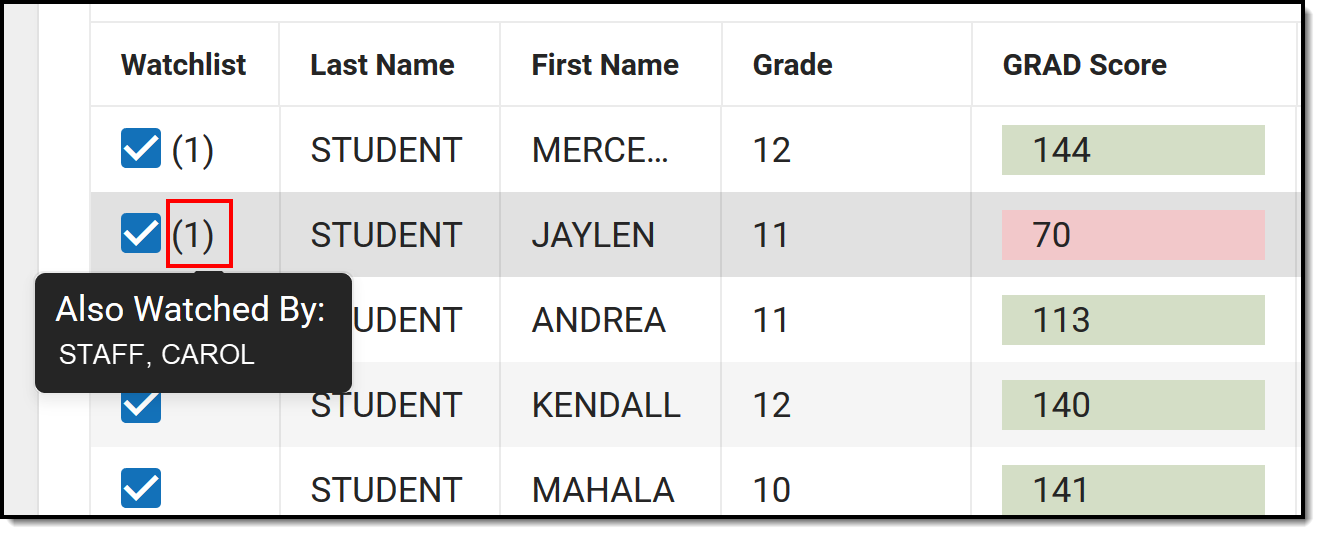
When returning to Early Warning, select the Watchlist button to return only the students you have chosen to watch. Other staff members may be watching the same students you are. A number is next to the checkmark, indicating how many others are watching that student.
 Other Watched Students
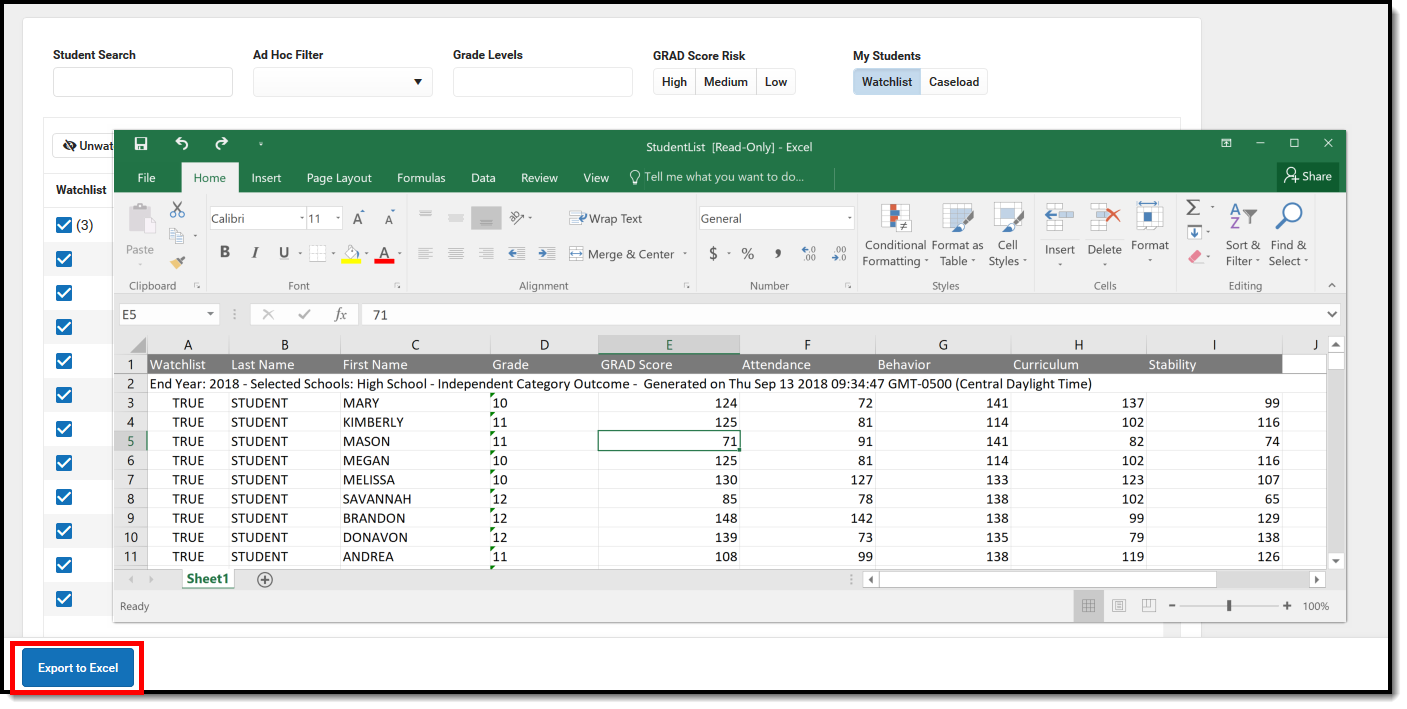
Export to Excel
Click the Export to Excel button to display the list of students in an Excel spreadsheet, where additional sorting can be done. This exports the list of students and data for those students exactly as displayed in the Early Warning tool.
- When viewing the list of students with the Independent Category Outcome type selected, the values for each category are listed in the Excel report.
- When viewing the list of students with the Category Impact type selected, the numeric value of the category type is listed. This can be used to determine which program a student could be best served in. This is the What If score: if an attendance value is 10 and the behavior value is 29, the GRAD score may improve more by working with the student on behavior interventions rather than attendance interventions. The Category Impact values should not be used to compare students.
 Exported Student List
Early Warning Student Detail
For more information on the values returned for each student, select that student from the list by clicking anywhere in any of the columns (except the Watchlist).


This Detail view can be generated as a PDF by clicking the View as PDF button. The PDF only displays expanded cards (see second image); if all of the cards are collapsed, only the Student Detail information displays (see first image).
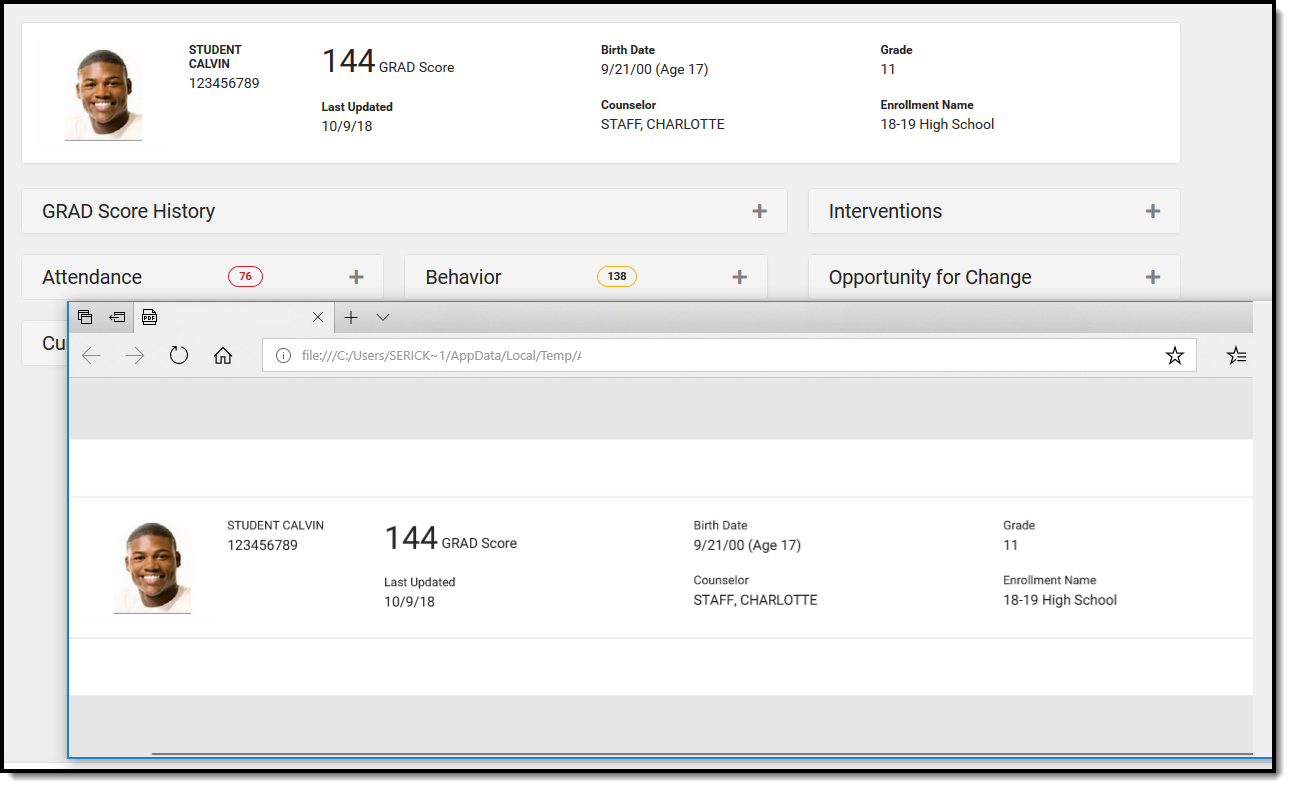 PDF View - Collapsed Student Detail Cards
Demographic Information
The Student Name and Birth Date data reports from the Person Information section of the Demographics tool, and the Student Number reports from the Person Identifiers section on the Demographics tool.
The Counselor is assigned on the Team Members tab, and its display is NOT tied to the Show Counselor in Student Header System Preference, like other areas where the Counselor's name displays.
Enrollment Name and Grade Level report from the Student Enrollment tab. The latest enrollment for the active year is listed.
The GRAD Score is displayed here for reference, along with a Last Updated Date indicating the last time GRAD Scores and Category Scores were calculated.
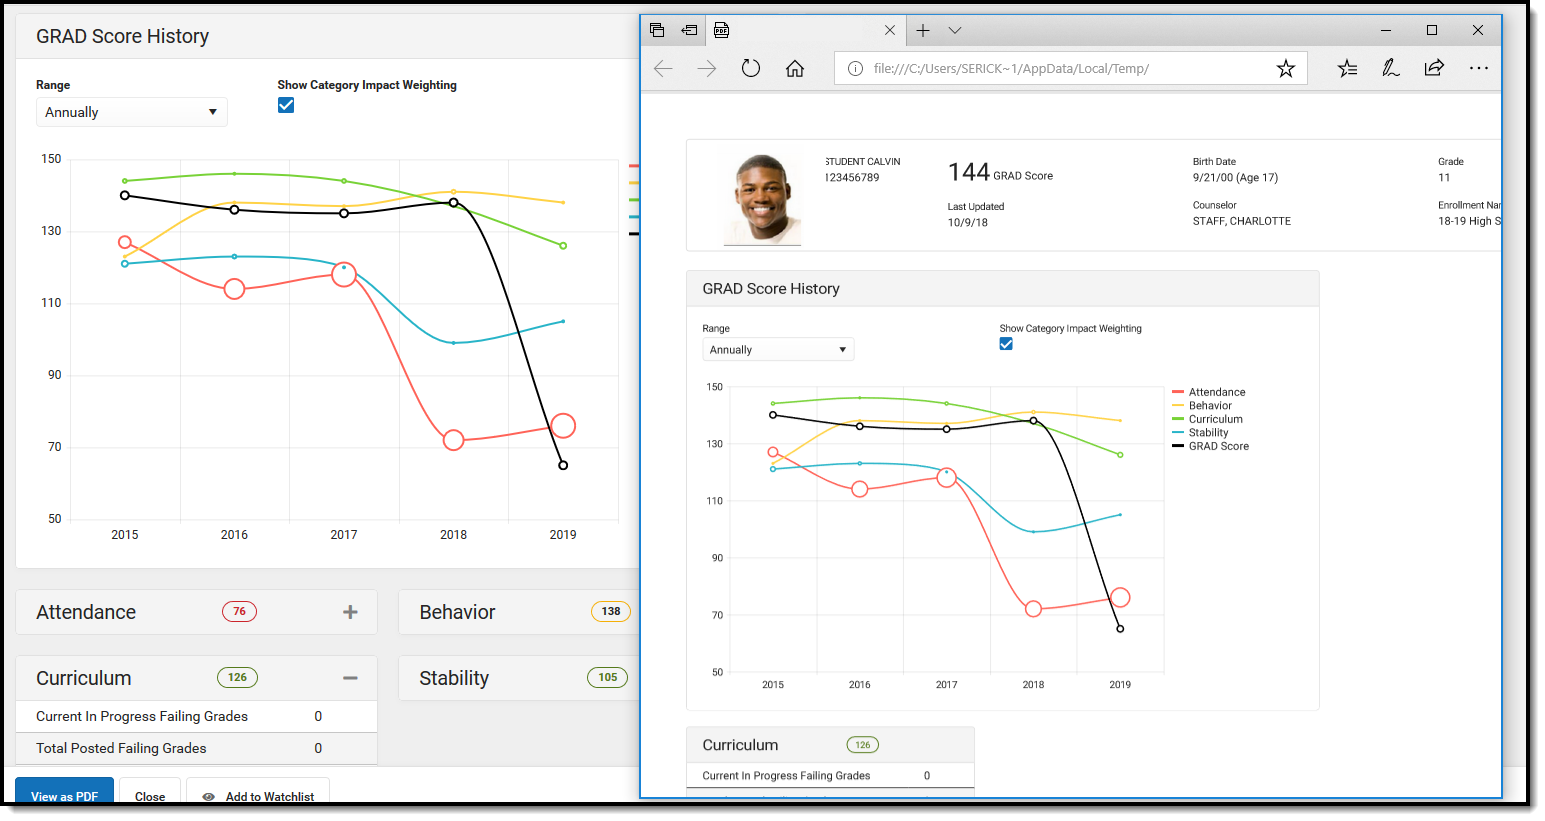
GRAD Score History
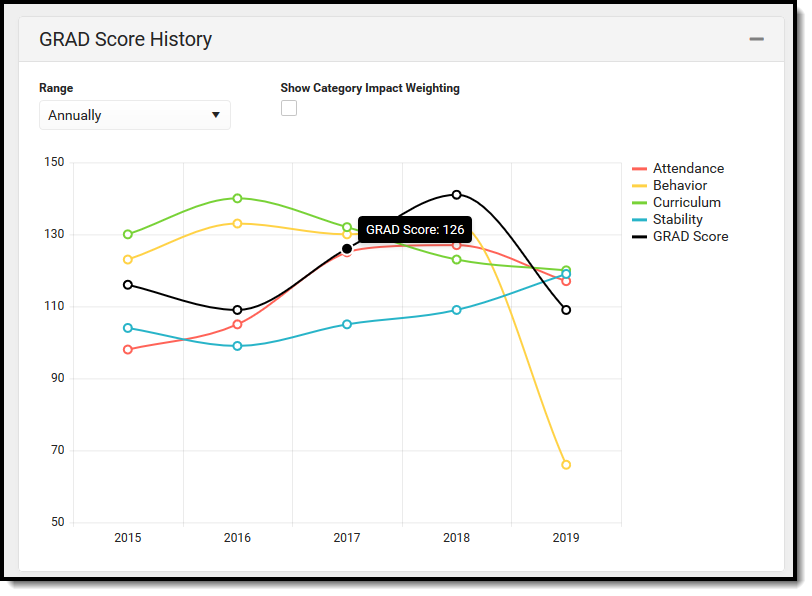
The GRAD Score History graph plots the student's GRAD Score and Category scores for a selected range—annually, last 12 months, last 30 days, and last 7 days. Users can hover over a plot point in the graph to see the student's score for that score type. Score types can also be removed from the graph by clicking on the legend on the right.
Monthly and daily history begins calculating when the Early Warning tool is available for a district.
The Range is set to Annually in the example below because the highest degree of change is visible.
 GRAD Score Graph
The example below sets the Range to the Last 12 Months. Notice there is a more significant dip in the Attendance and GRAD Score from August to September, and a larger change in the student's Behavior score. But, since the student's Stability is increasing slightly, that item has been removed from the graph (in the legend, that category is grayed out). Also, Show Category Impact Weighting has been turned on, changing the size of the plot points relative to the Category Impact Score at that time.
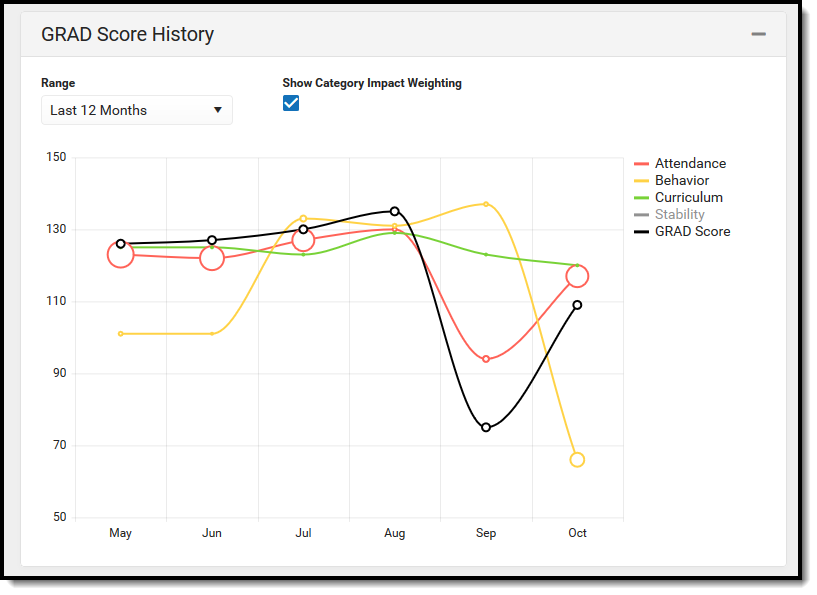 GRAD Score History - Last 12 Months, Category Weighting, Category Not DisplayingIf a student left the school (dropped out or temporarily moved out of state), scores may be missing for a time.
Click on any data point for any of the selected graph plots to display a list of events that may have contributed to a change in a student's score in the historical side panel. The following example shows a change in the student's Curriculum score from 2016 to 2018 (127 in 2015 to 84 in 2018). By clicking on the data point for 2015, a Category Detail panel opens on the side that lists the student's curriculum information; clicking the data point for 2018 shows changes in the student's GPA, perhaps contributing to the student's overall Curriculum score.
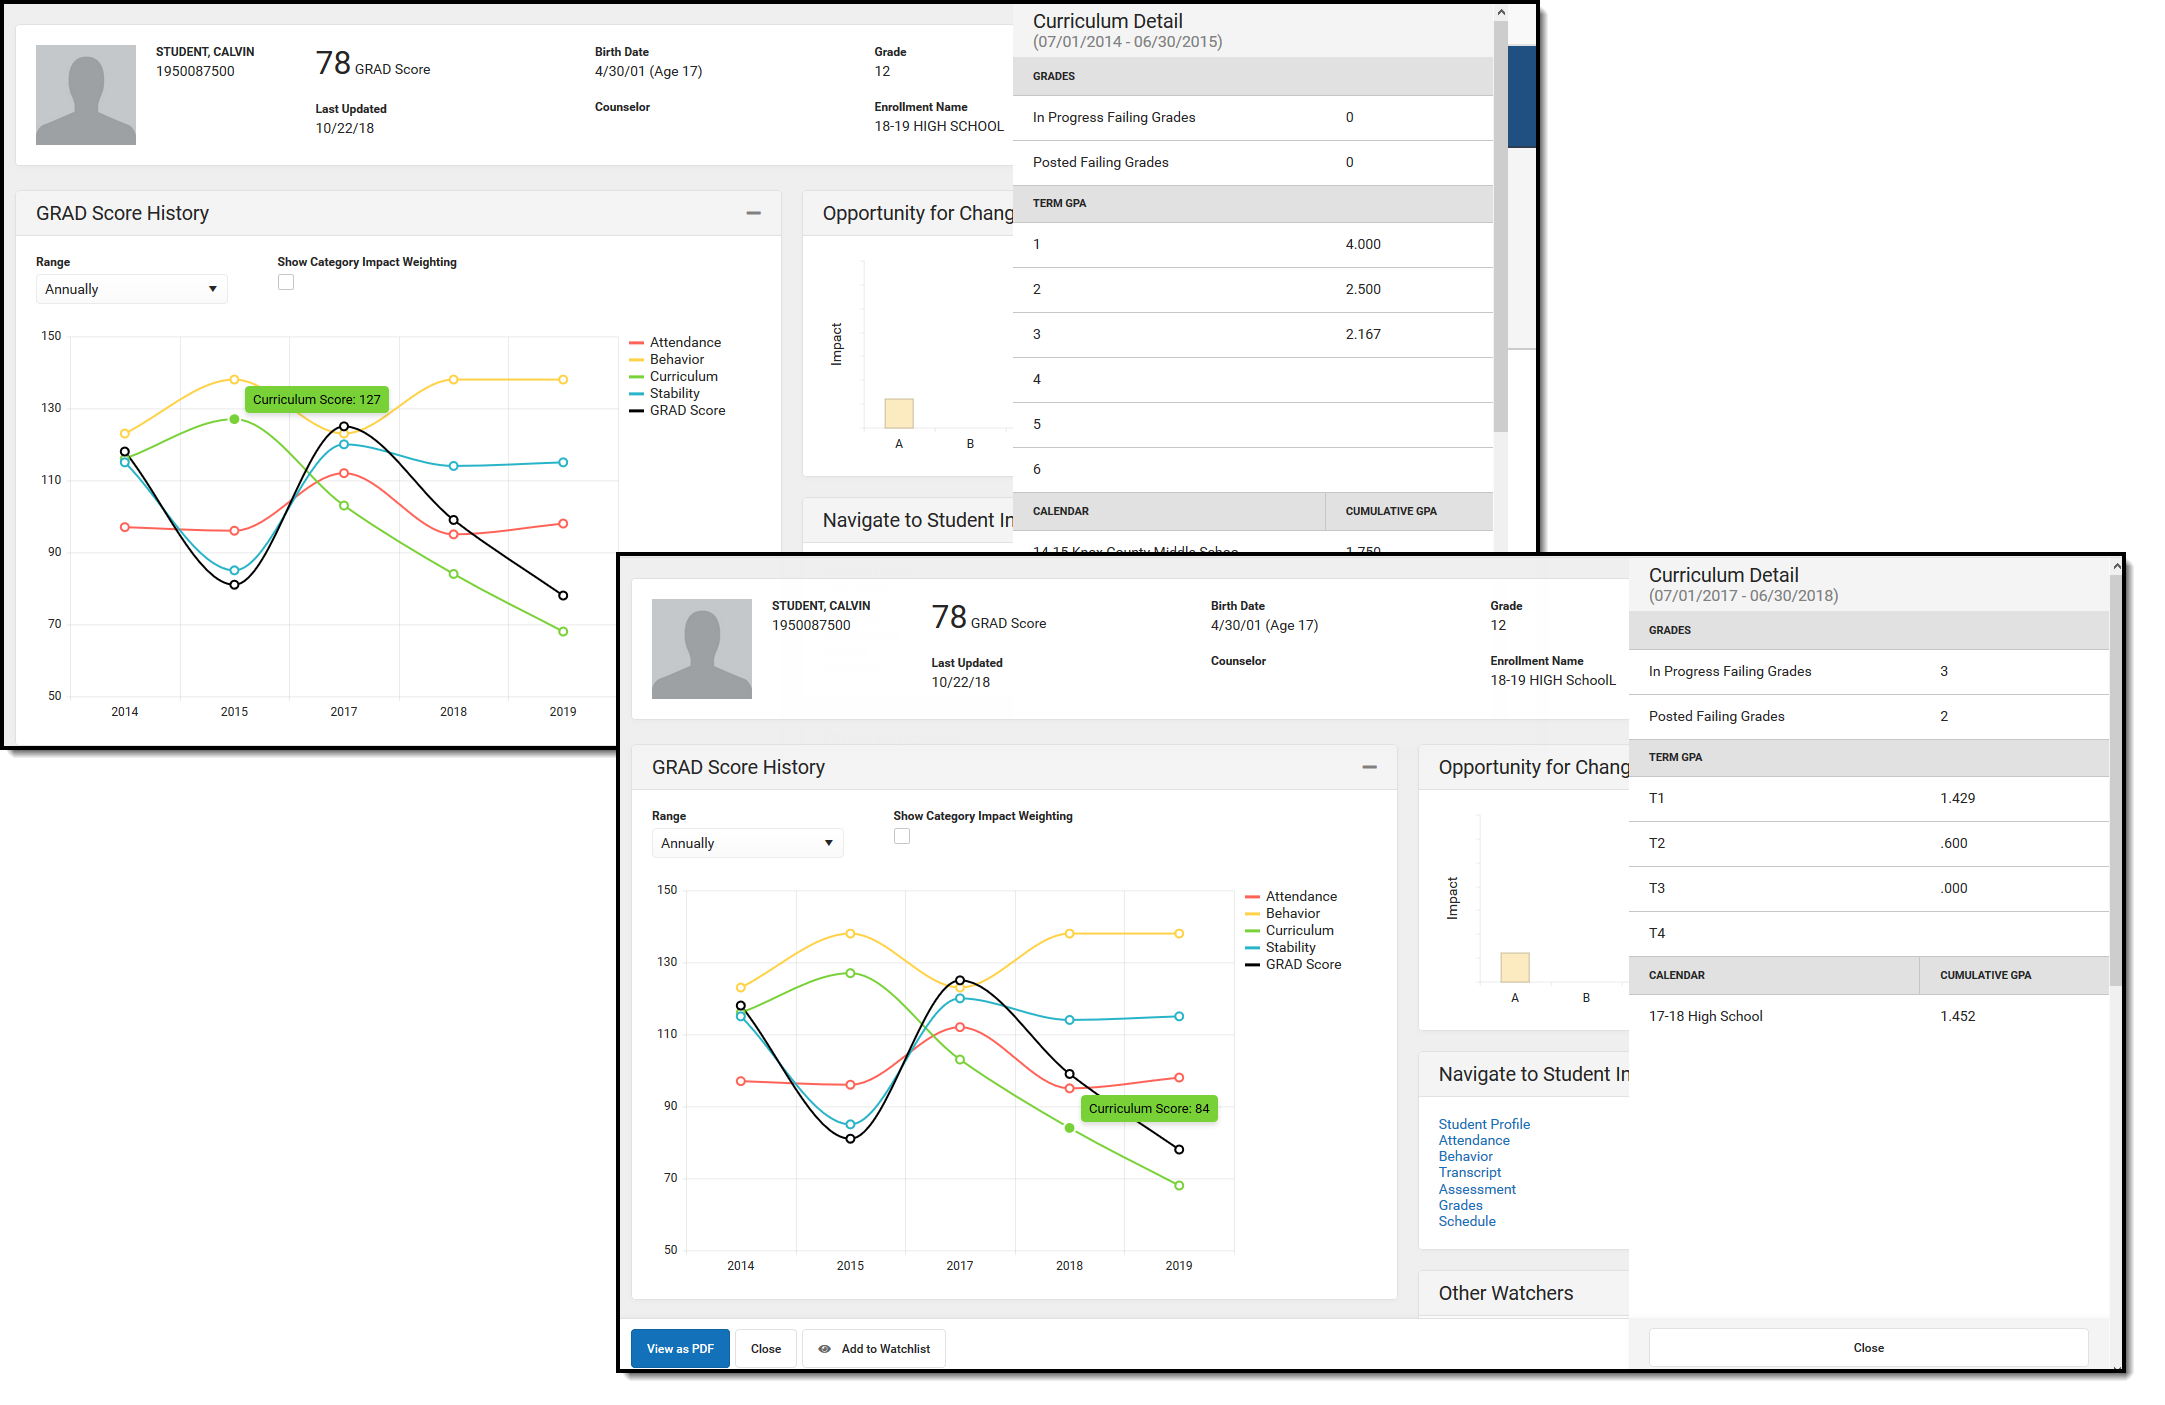
When viewing information in this side panel, click a data point for a certain time, review the data, and then click another data point. The side panel doesn't need to be closed to view information for that date range; the date range considered refreshed automatically, even when switching to another type of category (from Attendance data to Behavior data, for example). Click the Close button when finished reviewing historical data.
Past scores are predicted on the initial prediction for a school's scores. Twelve years of a student's past GRAD and Category scores are predicted back to the student's Kindergarten enrollment. When looking at a 7th-grade student, there are only 7 years of historical scores available; when looking at a 12th-grade student, there are twelve years (Kindergarten through the current date) of historical scores available, assuming all enrollments and data back to the Kindergarten year is available.
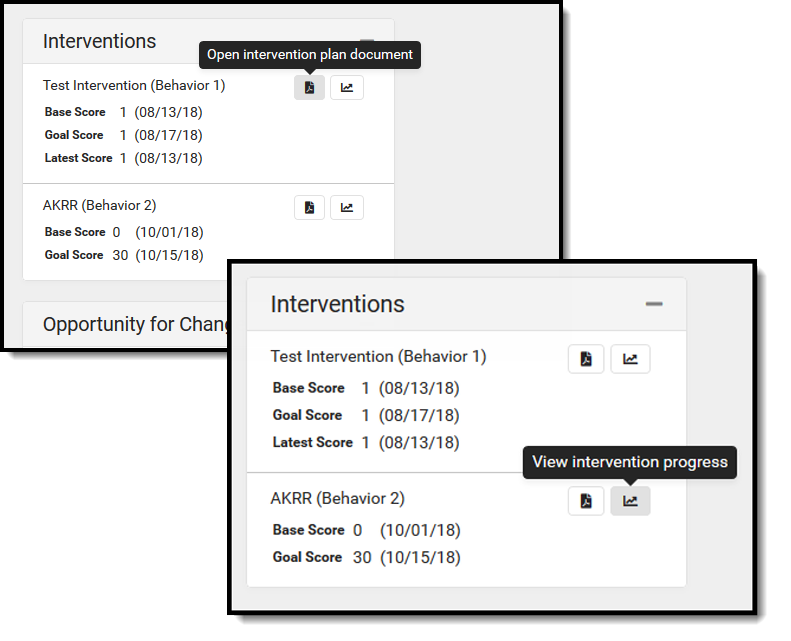
Interventions
Interventions are assigned to the student through the Response to Intervention tool. This card only displays if:
- The student has a locked Response to Intervention (RTI) plan.
- The user is an RTI plan Team Member for the selected student.
- The user's District Assignment record is marked for Response to Intervention.
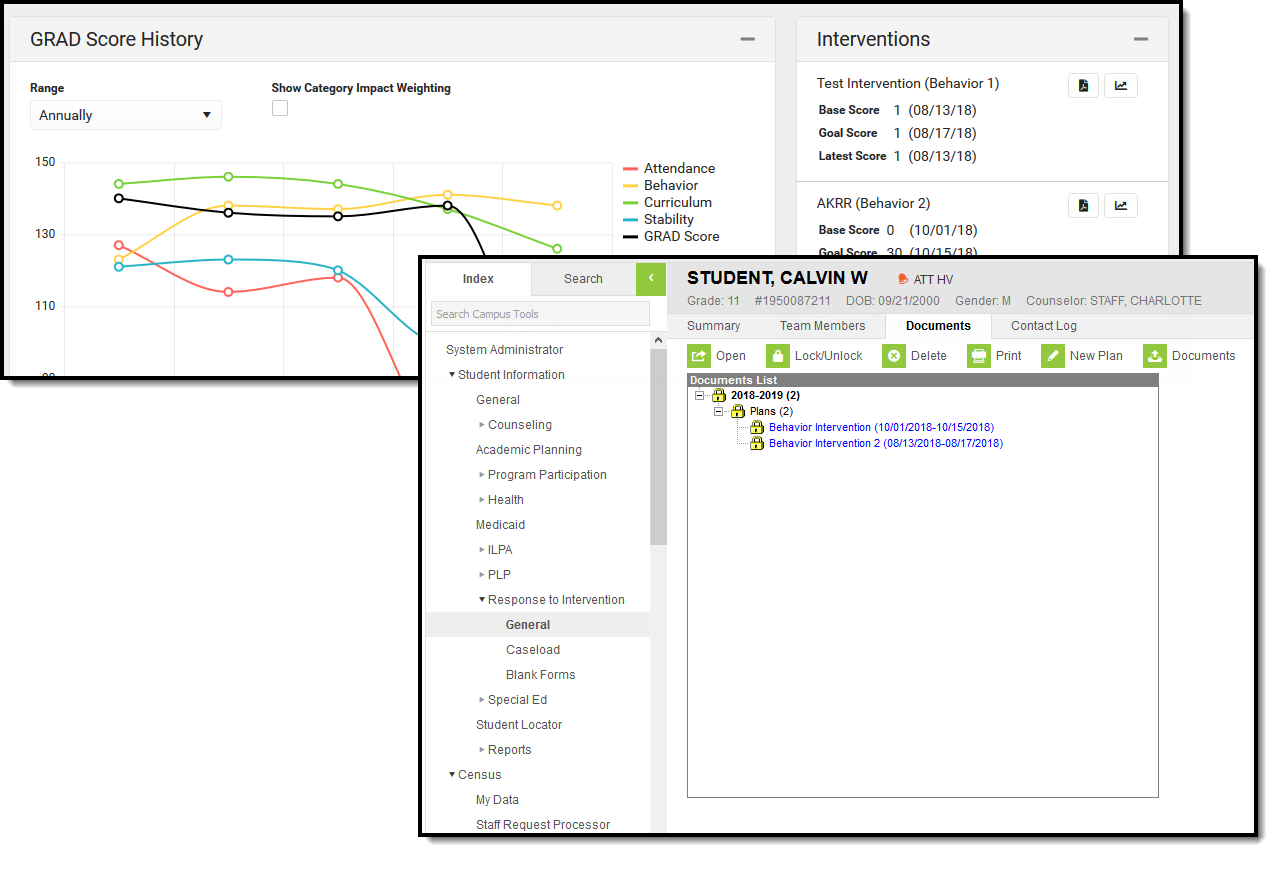
Click the first icon next to the plan name (Open intervention plan document) to print a copy of the locked intervention plan. Click the second icon to view a graph of the student's progress toward the intervention goal.
 Intervention Detail Options
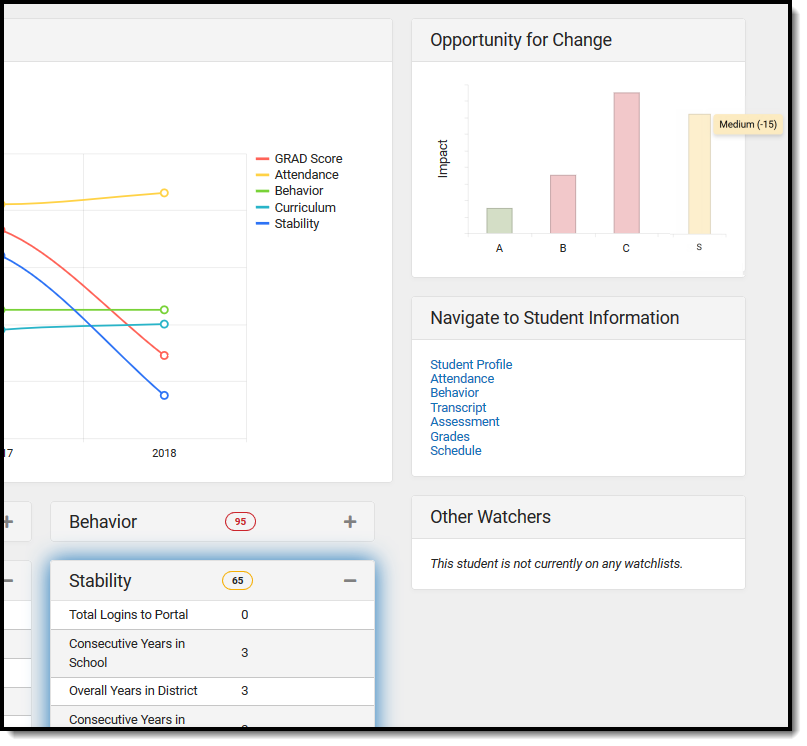
Opportunity for Change Graph
The Opportunity for Change graph lists in bar chart format which category most impacts the student's GRAD score. The categories are represented by the ABCS (Attendance, Behavior, Curriculum, Stability) and are color-coded to represent the student's risk level. When hovering over the bar, the total number of points by which the GRAD Score may be affected, the risk level of the score (high, medium, low), and the complimenting category detail are highlighted.
In the example below, the student's highest areas of opportunity are for Curriculum and Stability. Hovering over the stability bar shows the risk level, and the point value and stability card are illuminated.
 Opportunity for Change Graph
A category bar does not display when the user is not assigned tool rights to that category. A category bar may not show if the student has what is considered a "perfect" score - no attendance events, no behavior events, etc.
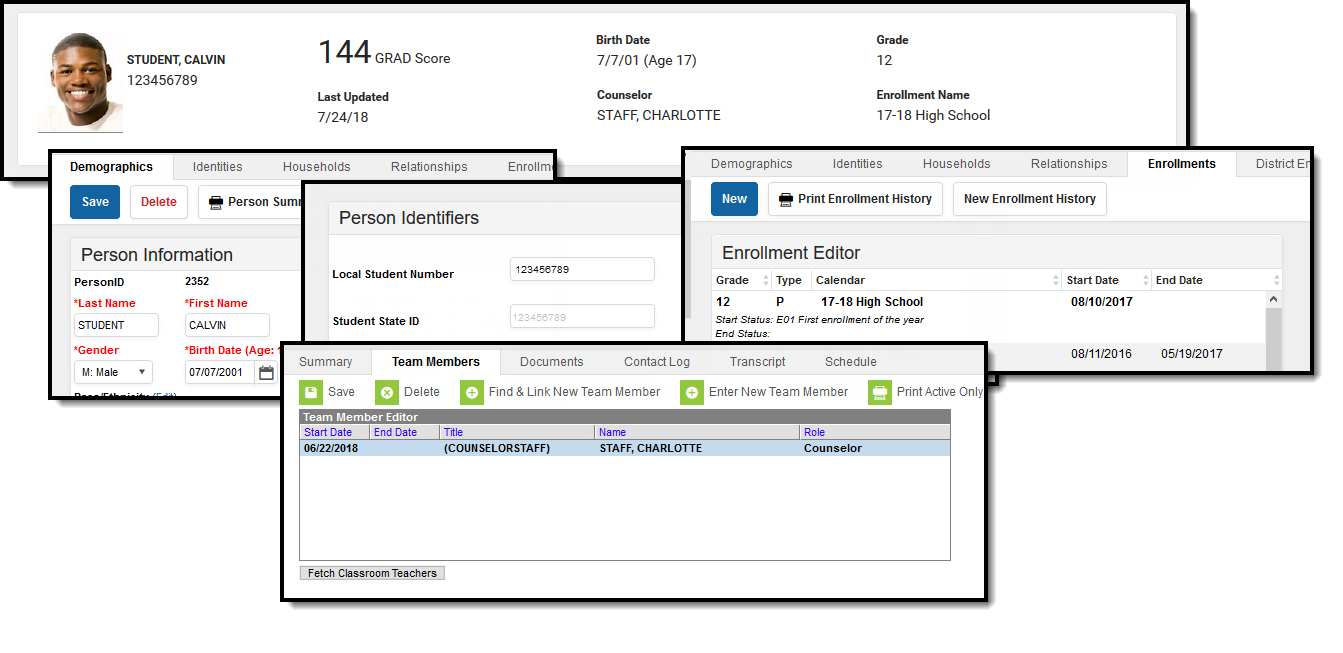
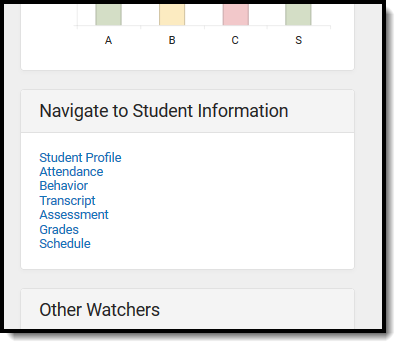
Navigate to Student Information
If tool rights are assigned, users can view other Student Information areas that also display and may affect the student's performance. This may be useful for finding out more information about a specific category.
 Student Navigation Options
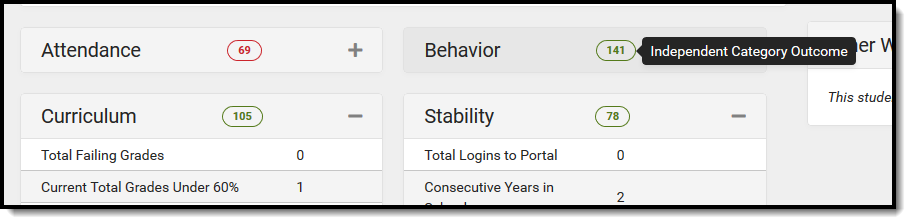
Category Cards
The Early Warning category scores are displayed on individual cards and represent the ABCS, like the Opportunity for Change card noted above. When these cards are collapsed, the score still displays. The score displayed with each card is the Independent Category Outcome score.
 Independent Category Outcome Score on Category Cards
Localized fields may be displayed here; note that descriptions of these fields are not included in this article.
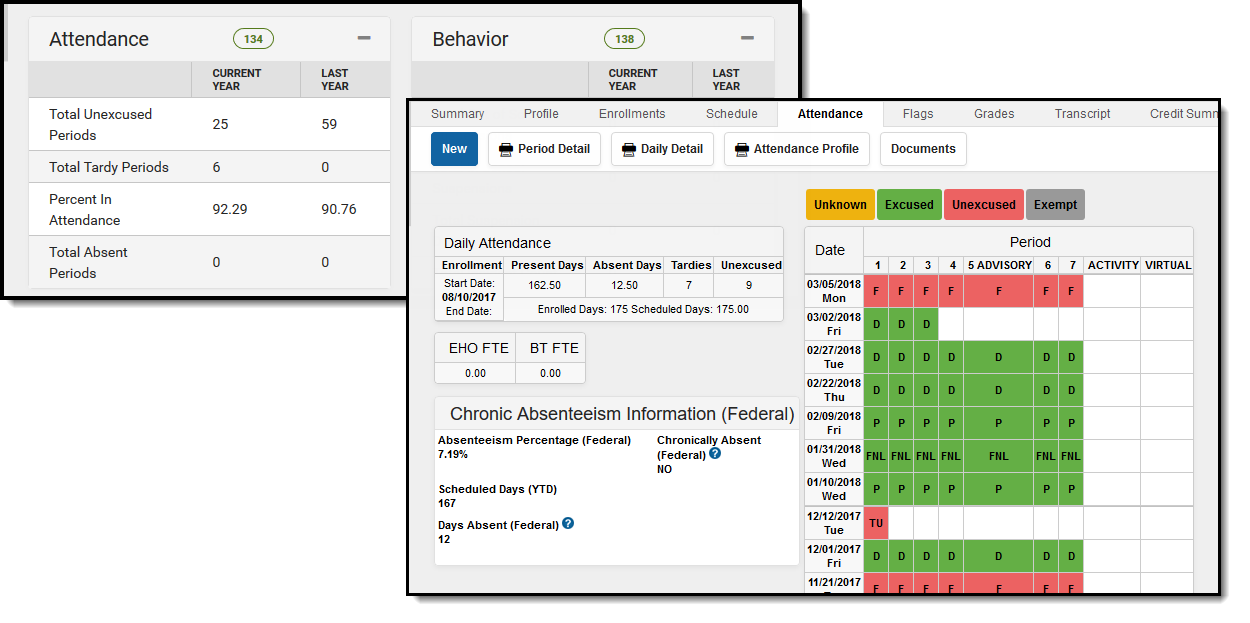
Attendance
The Attendance card lists attendance totals for the current year and last year for the following:
- Total Unexcused Periods (includes unexcused and unknown periods)
- Total Tardy Periods
- Percent in Attendance
- Total Absent Periods
These values are calculated from the student's entered attendance information and can be reviewed on the Student Attendance tool.
| Field | Description | Location |
|---|---|---|
| Total Unexcused Periods | Reports the total number of periods marked with an attendance code that are considered unexcused and unknown. Unexcused periods display in red on the student's Attendance tab; unknown periods display in yellow. |
Student Information > General > Attendance
Attendance Office > Settings > Attendance Code Setup
Attendance.status Attendance.excuse |
| Total Tardy Periods | Reports the total number of periods in which the student was considered tardy. This value includes both excused and unexcused tardies. |
Student Information > General > Attendance
Attendance Office > Settings > Attendance Code Setup
Attendance.status |
| Percent in Attendance |
The early warning Percent in Attendance uses a daily approximation method that relies on the calendar's whole Day Absence and Half Day Absence values to determine whole-day and half-day absences. This calculation only uses full-day (1) or half-day (0.5) absences.
To get the percent value, it is calculated 100 - (100 * (absent days / enrolled days)
Note: Due to a difference in the calculation, this attendance percentage may not reconcile with other attendance calculations found throughout campus. |
Calculated |
| Total Absent Periods | Reports the total number of periods in which the student has been marked absent. This value includes both excused and unexcused tardies, as well as absent/tardy events that are considered exempt. |
Student Information > General > Attendance
Attendance Office > Settings > Attendance Code Setup
Attendance.status |
Behavior
The Behavior card summarizes the student's Behavior events for the Current and previous years. The Student Behavior tool provides more information on these events.
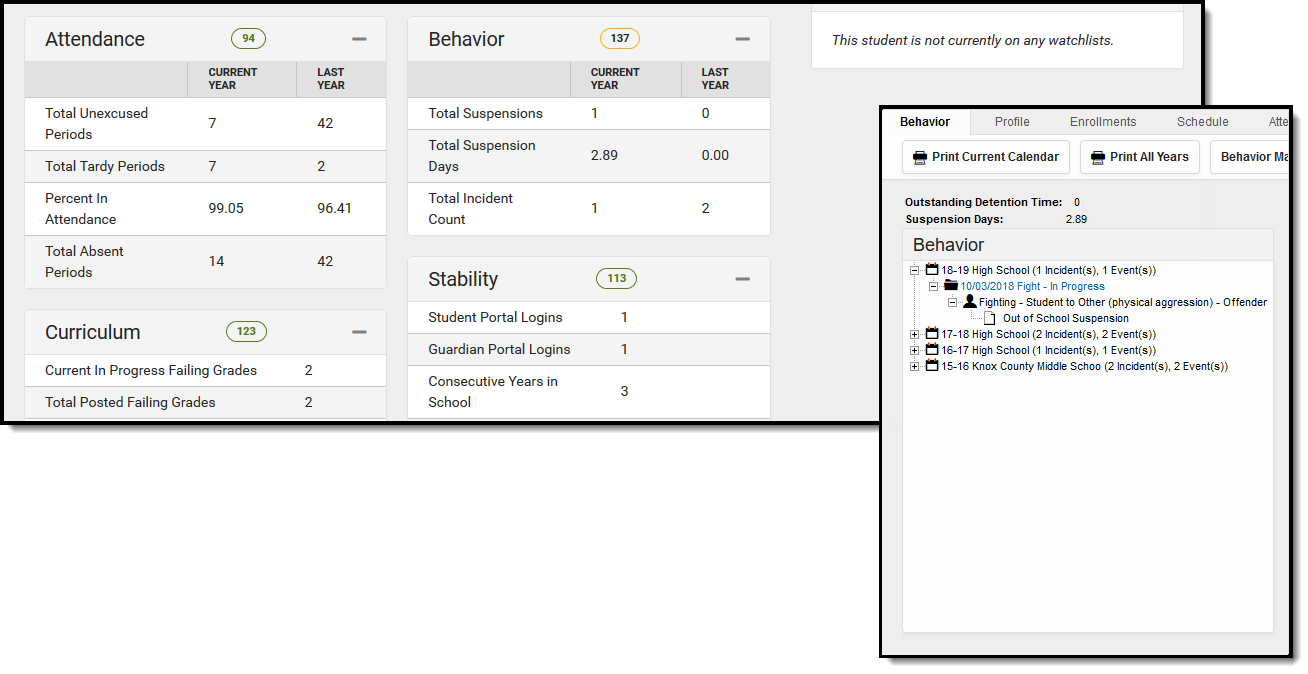 Behavior Card and Related Student Behavior Record
| Field | Description | Location |
|---|---|---|
| Total Suspensions | Reports the total number of behavior resolutions associated with a behavior event that has a code of Out of School Suspensions and In School Suspensions. |
Student Information > General > Behavior
Behavior > Behavior Management > Events and Participants > Resolution Details > Resolution Type
Behavior Office > Settings > Resolution Type Setup > State Resolution Code
BehaviorResType.stateResCode |
| Total Suspension Days |
Reports the total number of behavior resolution days associated with a behavior event with either a code of In School Suspension or Out of School Suspension.
This counts behavior resolutions assigned a Sub-Type of Suspension. |
Behavior > Admin > Resolution Types > Sub Type = Suspension
BehaviorEvent.eventID BehaviorResolution.roleID BehaviorResType.subType |
| Total Incident Count | Reports the total number of behavior incidents for a student where the student has a participant record.
Positive behavior events are not included in this count and are not considered by Early Warning calculations.
|
Student Information > General > Behavior
Behavior > Behavior Management > Events and Participants > Participant Details
BehaviorEvent.eventID BehaviorIncident.incidentID BehaviorIncident.status BehaviorResolution.roleID BehaviorResType.typeID |
Curriculum
The Curriculum card lists a series of items that reflect the student's success in current classes. The student's GPA information is also listed. Additional details on the scores can be found on the Student Grades tab and Student Transcript tab.
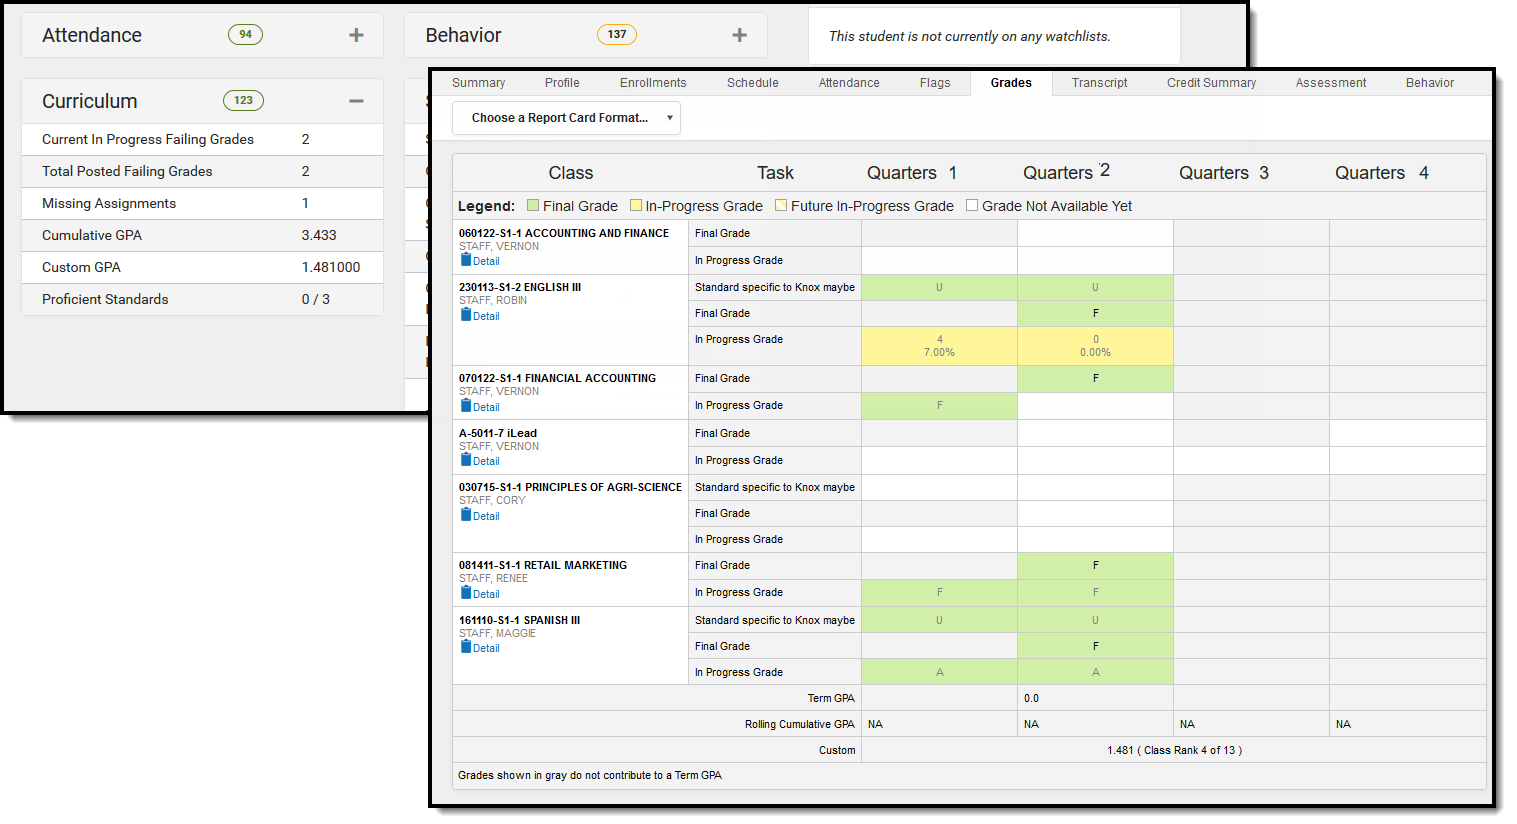 Curriculum Card and Related Student Grades
| Field | Description | Location |
|---|---|---|
| Current In Progress Failing Grades |
Reports the student's failing grades for current classes (that have not been posted).
This only calculates for Grading Tasks, not for Standards. |
Student Information > General > Grades
ScoreListItem.passingScore |
| Total Posted Failing Grades |
Reports the total number of failing grades that have been posted to the student's transcript.
Only the final posted grades from Grading Tasks that are aligned to credits and posted to the Transcript are included in this count.
"Failing" is determined by the posted score's associated Score Group. |
Student Information > General > Transcript
ScoreListItem.passingScore |
| Missing Assignments | Reports the total number of assignments that are marked as missing. This is done in the teacher's Grade Book. | Campus Instruction > Grade Book > Assignment Editor
LessonPlanScore. missing |
| Cumulative GPA |
Reports the student's cumulative grade point average.
See GPA Calculations in Campus for more information. |
Student Information > General > Grades
get_gpa_stats_all |
| Custom GPA |
Displays the student's GPA value for the school's custom GPA calculation.
This only displays when the school is using a custom GPA. |
Student Information > General > Grades
get_customGPA |
| Proficient Standards | The total number of standards in which the student is considered proficient. The numerator is any standard with a posted score that is considered passing in the current term; the denominator is the total number of standards assigned to courses in which the student is scheduled. | Student Information > General > Grades > Grade Book View > Standards Summary
GradingScorev_GradingDetailAll |
| On Track |
Displays Yes or No depending on the student's Academic Plan Progress.
This only displays when the student is assigned an active Graduation Plan in Academic Planning. |
Student Information > Academic Planning > Graduation Program > Progress
Program.gradPlanProgress |
| Earned Credits |
Lists the student's total number of credits the student has successfully completed towards their assigned graduation programs. These earned values are based on scores and credits that have been posted to the student's transcript.
This only displays when the student is assigned an active Graduation Plan in Academic Planning. |
Student Information > Academic Planning > Graduation Program > Progress
Program.gradPlanProgress |
| Remaining Credits |
Lists the student's total number of credits the student still needs to successfully complete the assigned Graduation Plan. This is based on the total number of credits assigned to the Graduation Plan, minus the number of earned credits the student has received and the number of in-progress credits the student is currently working on (in the IP column of the Progress tab).
This only displays when the student is assigned an active Graduation Plan in Academic Planning. |
Student Information > Academic Planning > Graduation Program > Progress
Program.gradPlanProgress |
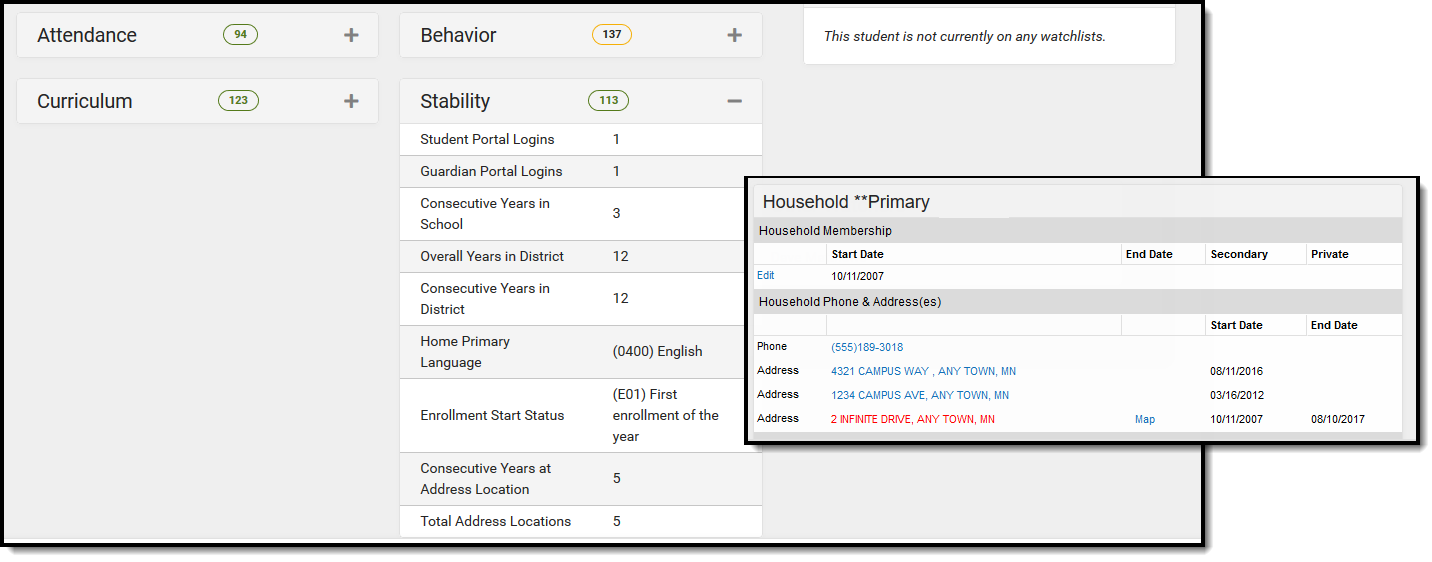
Stability
The Stability card lists items that affect a student's overall success - number of years in the same school and district, years living at the same address, primary language, and how many times the student or parent has accessed the Campus Student/Campus Portal.
Some of this information can be found on the student's Identities tab and Enrollments tab. Other information, like the total years at the same address, is calculated from the start date of the Address assigned to the Household. For students who have multiple households (multiple guardians have shared custody, for example), the address where the student resided for the longest time is represented.
|
Field |
Description |
Location |
|---|---|---|
| Student Portal Logins | Reports the total number of times the student has logged into Campus Student. | System Administration > User Security > Users > Access Log
SecurityAccesss.userID SecurityAccess.success |
|
Guardian Portal Logins |
Reports the total number of times the student's parent/guardian has logged into Campus Parent. | System Administration > User Security > Users > Access Log
SecurityAccesss.userID SecurityAccess.success |
|
Consecutive Years in School |
Reports the total number of years the student has been consecutively enrolled in the same school. |
Student Information > General > Enrollments > General Enrollment Information > Calendar
Calendar.schoolID Enrollment.calendar |
|
Overall Years in District |
Reports the total number of years the student has been enrolled in the same district. |
Student Information > General > Enrollments > General Enrollment Information > End Year
Enrollment.endYear |
|
Consecutive Years in District |
Reports the total number of years the student has been consecutively enrolled in the same district. |
Student Information > General > Enrollments > General Enrollment Information > Calendar
Enrollment.districtID |
| Home Primary Language | Reports the language most often spoken in the student's household. | Census > People > Demographics > Home Primary Language
Identity.homePrimaryLanguage |
| Home Secondary Language |
Reports the assigned alternative language spoken in the student's household.
This field only displays when populated on the Demographics tab, and may called Secondary Language, Native American Language, Alternative Language, etc. |
Census > People > Demographics > Secondary Language
Identity.languageAlt |
| Enrollment Start Status |
Reports the student's enrollment start status. |
Student Information > General > Enrollments > General
Enrollment Information > Local Start Status, State Start Status Enrollment.stateStartStatus Enrollment.localStartStatus |
| Consecutive Years at Address Location | Reports the total number of years the student has lived at the same address. For students in multiple households (multiple addresses), the value reports from the household with the longest number of years. | Census > People > Households > Addresses
HouseholdLocation.startDate HouseholdLocation.endDate |
| Total Address Locations | Reports the total number of addresses at which the student has lived. | Census > People > Households > Addresses
Calculated value |
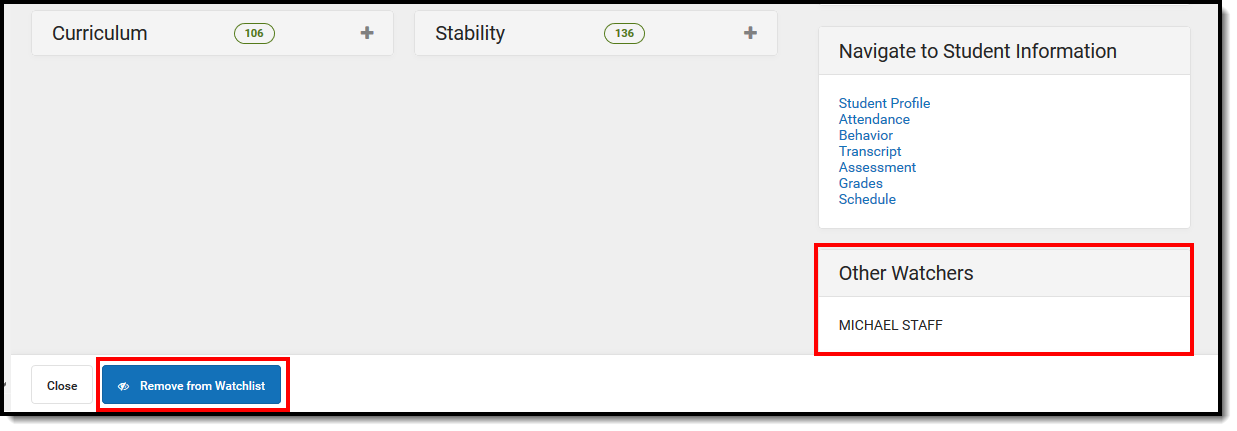
Watchlist Management
Other staff members may have chosen to watch this student. That individual's name is listed in the Other Watchers section. The number of staff who can add that student to their watchlist is unlimited. If no other staff members are watching the student, that is also stated in the Other Watchers card.
- If a student needs to be removed from the watchlist, click the Remove from Watchlist button. To add a student to the watchlist, click the Add to Watchlist button. This action only adds the selected student to the watchlist.
- If an entire set of students needs to be added, that can be done from the Student List on the main view of Early Warning. Add a reasonable amount of students to the watchlist. A watchlist of 2000 students is not beneficial.
 Watchlist Management

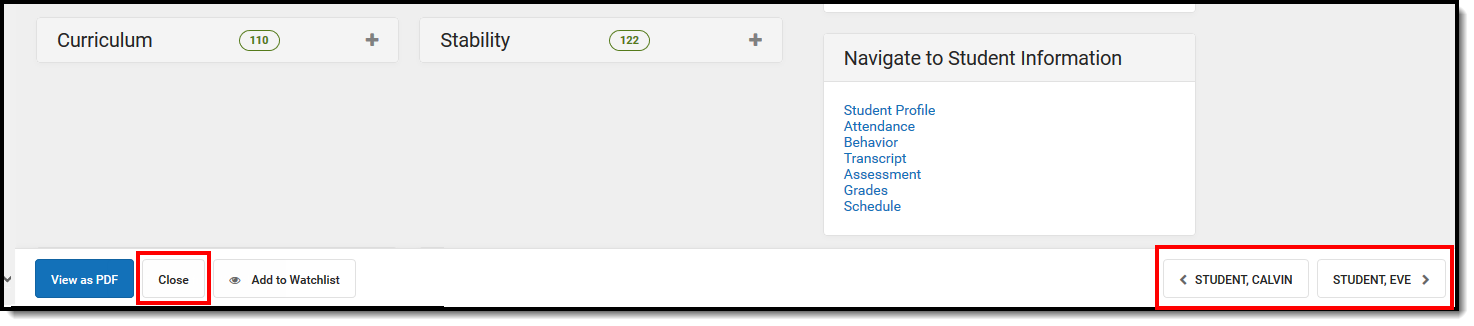
View Other Students
When finished viewing the details of the selected student:
- Click the Close button to return to the previous view of the Score Distribution Chart and list of students.
- Choose the next or previous student to view Student Detail information by clicking on their name in the lower right-hand corner.
 Option to Return to Main View or View Next Students
GRAD Score Changes
GRAD Scores and Category scores can change suddenly and drastically as student data changes. The GRAD Score changes drastically if the predictive model 'sees' new information that is highly predictive of dropout or graduation that wasn't there previously. A GRAD Score incorporates much information about a student and produces a risk metric. As information in those parts of District Edition changes, the GRAD Score (and category scores) change to reflect the student's updated risk estimate.
Seeing score changes and not knowing what caused them can be concerning. The following provides some insight into why a GRAD Score changed.
Step 1: Check the latest Data Science Release Notes
Model changes are announced in the Release Notes and should be the first place to reference for updates.
Step 2: Check the Category Scores
If one of the category scores changed in the same direction, at the same time, the data change was in that category.
Step 3: Check data sources used in a particular category
Attendance:
The Attendance score is sensitive to the number of missed periods with an excuse code of Unexcused or Unknown. Look for recent absences in these categories. Overall Percent In Attendance is also a very strong predictor of dropout, so the score may have changed if the student had many absences of ANY type.
Behavior:
Behavior events do not predict dropout as strongly as previously thought. If a corresponding change occurs in the Behavior score, see whether the student has any recent resolutions. The statistical model heavily uses the count of all behavior resolutions.
Courses:
The courses (known as academic) sub-score is very sensitive to students having failing grades in their courses.
- In the Grade Book, see if the student has a course grade that has recently crossed the 60% threshold. Both the GRAD Score and Courses score weight the number of courses for which a student has a current failing grade.
- If grades have recently been posted in the Student Transcript, see whether the student's GPA or credits-earned percent has changed.
Stability:
Stability scores measure factors that ought to change less frequently than other scores. A stability score change can be expected if a student changes schools or districts, especially mid-year and mid-grade. If the student ends an enrollment, particularly with a negative end status, it can impact the score. A smaller change may be due to a student changing addresses or households mid-year.
Step 4: Check data sources that are not used in any score
Several factors are used in the overall GRAD score that are not present in individual scores—in particular, assessment scores, health office visits, certain student programs (such as Gifted/Talented), demographic factors of individual students, and contextual factors describing their school and district. A score is not provided for these factors because they're not within a counselor's ability to change, and they should change slowly or never.
See if there is new information in the Enrollment or Identity records.
