Tool Search: Consolidated Report Card
On-track attendance shares the percentage of students who are not chronically absent. Students must be present and prepared to learn in order to succeed academically. Chronically absent students are those students who are absent for any reason (excused or unexcused), such as illness or out-of-school suspension, for 10% or more of a school’s total school time between October 1 and May 31.
 Attendance Report- Race /Ethnicity and Other Characteristics
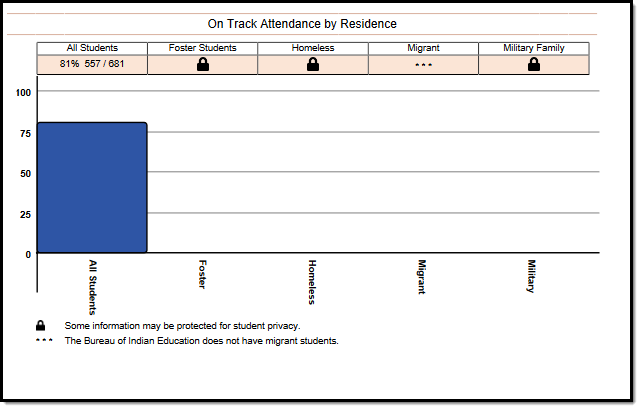 Attendance Report -Residence
Logic
This section of the BIE Consolidated Report Card & Individual School Report Card uses student data records stored on the BIE Attendance Data Mart certification table.
For more information about the data marts, their data tables, and the logic that is used, refer to the BIE Attendance Data Mart and Data Mart Workflow articles.
Report calculation used:
For each section, an overall percentage is displayed. This percentage is further broken down into demographic subgroups that students may fall into. For each percentage displayed, the following calculation is used:
Individual School Calculation:
(Population of students in subgroup / Population of 'All Students')*100
BIE Calculation:
(Population of students in subgroup across all BIE schools / Population of 'All Students' across all BIE schools)*100
On-Track Attendance Field Descriptions
If a subgroup has ten or fewer students, it will display a lock icon to protect student privacy and prevent student identification.
Data reported for the Attendance section of the BIE Consolidated Report Card & Individual School Report Card is collected directly from the BIE Attendance Data Mart. Additional information about each field included in this report can be found in the BIE Attendance Data Mart Reported Fields section of the BIE Attendance Data Mart article.
| Field | Description | Location |
|---|---|---|
| On-Track Attendance By Race/Ethnicity Reports the total percentage of students broken down by Race/Ethnicity who have 90% or higher attendance. | ||
| Race/Ethnicity | Calculated to report as a percentage. Reports the total percentage of students from the attendance data mart who have the countDate column set by Race/Ethnicity. | Data Mart: BIE Attendance Data Mart Data Table: BIEDMAttendanceCertification Data Mart Element: Race Ethnicity |
| On-Track Attendance By Other Characteristics Reports the total percentage of students broken down by Other characteristics who have 90% or higher attendance. | ||
| All Students | Calculated. Students must have a NASIS ID to be included. | Data Mart: BIE Attendance Data Mart Data Table: BIEDMAttendanceCertification Data Mart Element: NASIS ID (Total) |
| English Learners | Calculated to report as a percentage. Data mart logic used: Refer to the English Learner description of the BIE Attendance Data Mart | Data Mart: BIE Attendance Data Mart Data Table: BIEDMAttendanceCertification Element: englishLearner |
| Low Income | Calculated to report as a percentage. Data mart logic used: Status of 'Y' always reports. | Data Mart: BIE Attendance Data Mart Data Table: BIEDMAttendanceCertification Data Mart Element: Economically Disadvantaged |
| Students with Disabilities | Calculated to report as a percentage. Data mart logic used: Identified as the student's primary disability from their latest plan for the selected school year. Only Locked BIE IEPs and BIE IEP with Transition plans report. | Data Mart: BIE Attendance Data Mart Data Table: BIEDMAttendanceCertification Data Mart Element: Primary Disability |
| On-Track Attendance by Residence Reports the total percentage of students broken down by Residence who have 90% or higher attendance. | ||
| All Students | Calculated. Students must have a NASIS ID to be included. | Data Mart: BIE Attendance Data Mart Data Table: BIEDMAttendanceCertification Data Mart Element: total nasisID |
| Foster Students | Calculated to report as a percentage. Data mart logic used: Identified as the student's BIE foster care status for the selected school year. | Data Mart: BIE Attendance Data Mart Data Table: BIEDMAttendanceCertification Data Mart Element: fosterCare |
| Homeless | Calculated to report as a percentage. Data mart logic used: Identified as the student's homeless status of the Homeless Nighttime Residence field from the last year of their enrollment within the cohort. | Data Mart: BIE Attendance Data Mart Data Table: BIEDMAttendanceCertification Data Mart Element: homeless |
| Migrant | Does not report. The BIE does not have migrant students. Data mart logic used: Always reports as N. | Data Mart: BIE Attendance Data Mart Data Table: BIEDMAttendanceCertification Data Mart Element: migrant |
| Military Family | Calculated to report as a percentage. Data mart logic used: Identified as the status of the student's relationship to the military for the selected school year. | Data Mart: BIE Attendance Data Mart Data Table: BIEDMAttendanceCertification Data Mart Element: militaryConnectionStatus |
Other Sections
The BIE Consolidated Report Card includes the following sections:
