Tool Search: Early Warning
Early Warning provides school administrators, counselors, principals, etc., the ability to see a student's persistence toward graduation (successful completion of high school), and the likelihood of being promoted to the next grade level. School personnel can compare one student's likelihood to their peers, and more effectively intervene on behalf of a student to increase the likelihood of promotion. Early Warning can be used with students in grades K-12.
For full access to Early Warning, users must be assigned Read rights to the following:
Student Attendance Details Student Curriculum Details Student
For more information about Tool Rights and how they function, see the Tool Rights article.
Early Warning
The predictive analysis that Campus employs to generate a student's GRAD score is ever evolving and is constantly updated as new data is entered into Campus. A student's GRAD score includes (but is not limited to) the following categories of data:
|
|
The following videos are available for more information on Early Warning.
Early Warning learns statistical relationships between educational records and enrollment outcomes. Machine learning uses computers to find evidence-based predictors of student outcomes using a large amount of anonymous data. To estimate a student’s likelihood of a particular enrollment outcome – such as dropping out of school – the computer system compares their record to past records of other similar students.
Advantages of a machine learning system for Early Warning include:
- The machine-learned statistical model has better predictive power than heuristics published in dropout prevention literature.
- The student information system can detect changes in educational data faster than staff members can, and update GRAD scores accordingly.
Submit feedback for Early Warning by clicking the Feedback button in the bottom right hand corner. This opens a side panel where you can rate your experience with the Early Warning tool and provide comments for improvements for our development team. You can also access the Campus Community Early Warning forum topic to exchange ideas with other Early Warning users and Infinite Campus staff.
Ad Hoc Filter Designer Early Warning Information
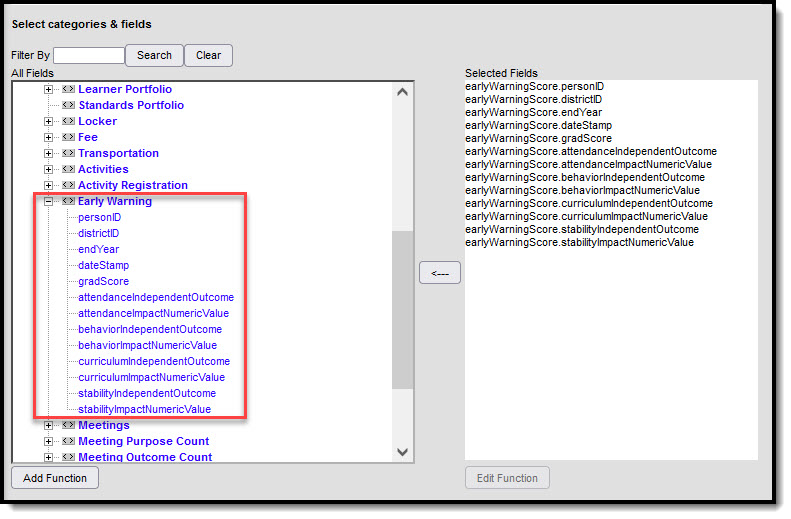
Early Warning information is available in the Filter Designer when creating Student Data Type filters.
These fields are located in the Student > Early Warning folder.
 Early Warning Ad Hoc Reporting Fields
Early Warning Definitions and Calculations
Historical data for all students is used to calculate the scores. The application of that score to different categories and different types of scores varies.
The following table lists the definitions and calculations of the terms used in Early Warning.
| Term | Description | Interpretation of Score |
|---|---|---|
| GRAD Score |
Acronym for Graduation Related Analytic Data, and represents the score that summarizes a student’s educational record with a single number indicating the student's likelihood of promotion to the next grade level. It measures factors predictive of dropping out and factors indicative of a student's persistence to the next grade level or to graduation.
A GRAD score is not provided for a student when there is no active primary enrollment record on the date the scores were calculated, or when the student is new and has too little information available to calculate a GRAD score. |
A GRAD score is between 50 and 150.
A score closer to 150 indicates the student has less risk of not being promoted to the next grade level; A score closer to 50 indicates the student has more risk of not being promoted to the next grade level. |
| Category Impact Score |
This score uses all of a student's data, but imputes perfect values into a category subset of columns that are intended to forecast how much an intervention in a category would change the student's GRAD score, based on historical data for that student and other students in the same situation. |
An Impact score is between 0 and 100.
An Impact Score that is closer to zero requires less need for intervention. |
| Independent Category Outcome |
This score uses a single category subset of columns of a student's original data (e.g., just the attendance-related columns), intended to explain the GRAD score and changes in a predictable manner as a student's category-related data changes.
|
An Independent Category Outcome Score is between 50 and 150.
A score closer to 150 indicates the student has less risk of not being promoted to the next grade level; A score closer to 50 indicates the student has more risk of not being promoted to the next grade level. |
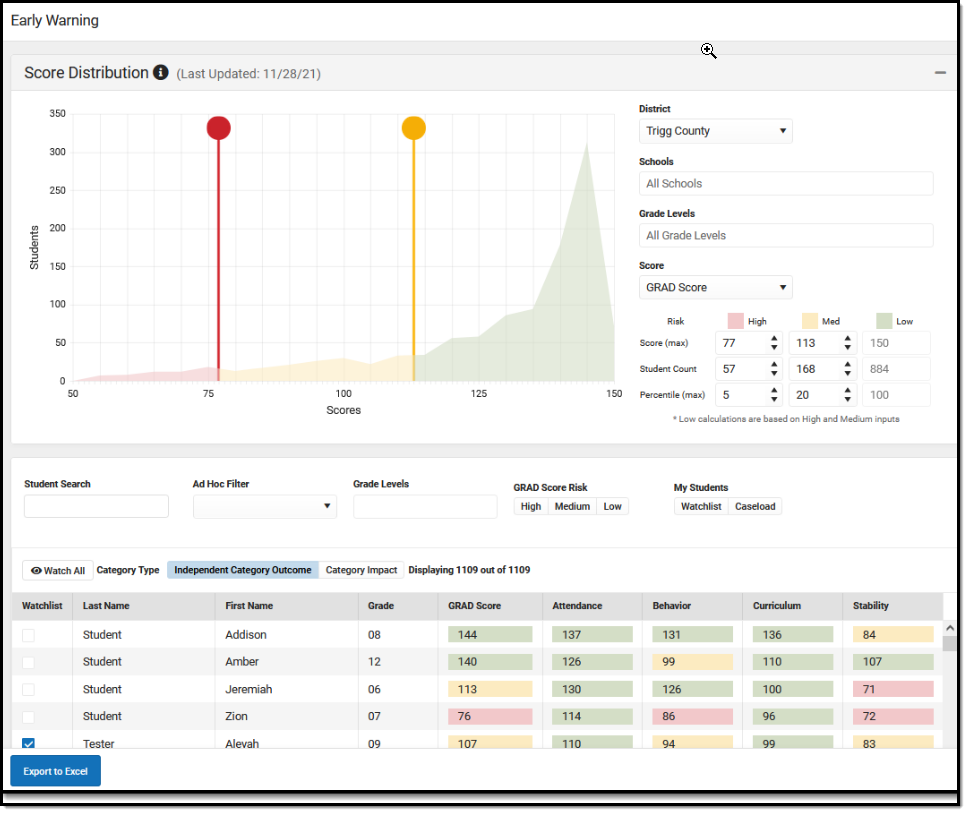
Score Distribution
By default, the Score Distribution displays the selected district's score distribution for all students on a grid, with students on the left (Y Axis) and scores across the bottom (X Axis). Based on the entered tier definitions, selected school(s), selected grade level(s) and selected Score type, the score distribution changes.
The chart of scores is color-coded to show the placement of students which correspond to the entered Tier values. The line placement between each of the colors, indicating High, Medium and Low, are marked at the break point between the scores.
 Score Distribution Display
Use the filter options noted below to narrow the results of the Distribution Chart and the students returned.
Anytime changes are made to the filter options, the grid and the list of students adjusts.
| Filter Option | Description | ||||||||||
|---|---|---|---|---|---|---|---|---|---|---|---|
| District
|
The District for which Early Warning data will be presented and specific schools will be made available for selection. | ||||||||||
| Schools | The school(s) for which Early Warning data will be presented. All schools can be selected, but viewing data for all schools in the district at one time may not be beneficial.
This is a searchable list. Begin typing the name of a school or scroll through the list. Click the X next to a school's name to remove it from the field. | ||||||||||
| Grade Levels | Choose which grade levels to consider. If multiple high schools are selected, choosing just the 12th grade may provide more knowledge of how the senior class is doing across the district. Another option is to not select any grade levels, which is the same as choosing All Grade Levels. | ||||||||||
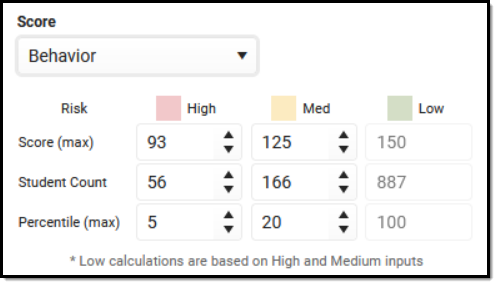
| Score
|
Select the type of score you wish to view.
Only one score type can be selected at a time. When a specific score type is selected, the list of students refreshes and displays results and color-coding based on that selected type.
Changing the values for the score, student count, percentage and risk levels changes the list of students.
|
Tier Definitions
Enter the desired values for Score, Student Count and Percentile for each High, Medium, and Low threshold. Percentile values can be modified by typing in the fields or by using the up/down arrows. On refresh of the tool, the tier settings return to the default values.
- A value closer to 50 indicates the student is at a higher risk for non-promotion, and displays in red.
- A value closer to 150 is at a lower risk of non-promotion and displays in green.
- A value that falls between 50 and 150 tier definition boundary lines indicates the student is at a medium risk for non-promotion, and displays in yellow.
Or, use the default entries, which are a maximum percentile of 5% of the student population (high, more risk), 21% of the student population (medium, moderate risk), 100% of the student population (low, less risk).
Intervention in some areas may benefit some students that have a high risk score in a certain category, while other students may not benefit from such programs, or certain events may have caused a change in a student's score, and an intervention may not be the best way to affect change for that student (natural disasters, etc.).
When one score is changed for one of the tier definitions, every value adjusts accordingly. For example, when a counselor is viewing the 12th grade students at the high school and changes the Score values from 50, 100 and 150 to be 76, 110, and 150, the student count changes to match the entered Score values, as does the Percentile values.
If the entered values do not match results, data is overridden to list the students that do match the entered values. For example, if there are ten students who have a GRAD score of 50, and 20 students have a GRAD score of 55, and the Student Count is set at 15, the ten students who have a GRAD score of 50 are listed.
Only whole numbers can be entered. If no value is entered, the box turns red and a warning message displays indicating a value for that field is required.
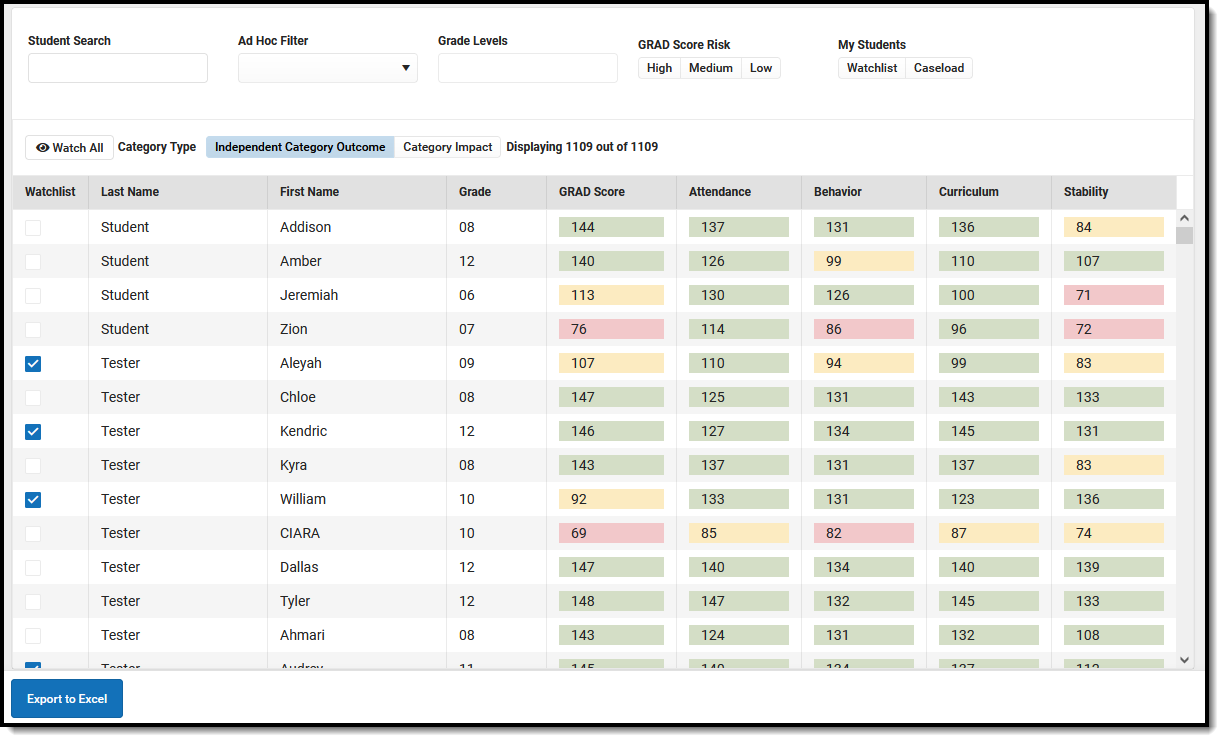
Student List
Based on the selected district, school(s), grade level(s), and entered scores, students matching these values are listed in the Student List section. Additional filters can be entered, like a pre-existing ad hoc filter, grade level, or a specific student. The default sort is by alphabetical by last name. Click the column headers to resort the list of students.
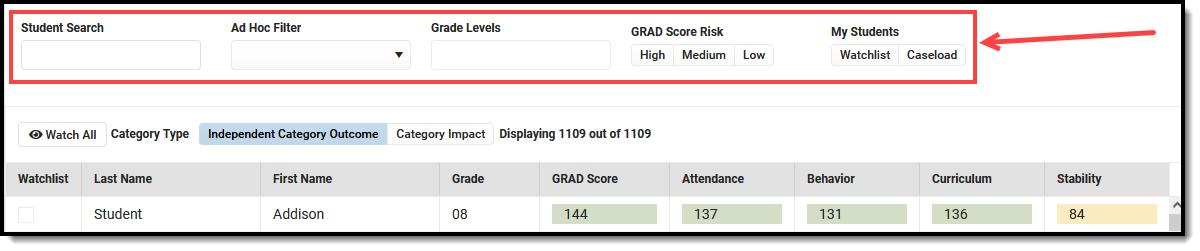
Filter Criteria
Filter fields are available so you can further narrow the results of students in the student list. This is useful when staff members want to focus on a smaller group of students (or individual student) who may need intervention.
| Field | Description |
|---|---|
| Student Search | Enter part of a last name or first name to only display specific students. This field searches as the user types, and results change as more information is entered. |
| Ad hoc Filter | Select a saved ad hoc filter from this list. This list of filters only includes those using the Student Data Type (not Census/Staff, not Course/Section). Users must have tool rights to Ad hoc Reporting and to the selected filter. |
| Grade Levels | Select the grade levels from the list. Multiple grades can be selected, and only those grade levels included in the Schools selected on the Score Distribution card are included. If only the High School calendar is selected, only those grade levels are available for selection. |
| GRAD Score Risk | All GRAD Score Risk levels can be displayed (High, Medium, Low). To only see those who have a High risk of non-promotion, select High. All risks can be selected, but this returns the same list as having no other filters selected. |
| My Students |
Staff can choose the students in their Caseload, which returns any student on their caseload (where they are assigned any Team Member Role or any Plan Type).
This list can also be set to only show those students who have been marked as Watchlist. This is done by marking the Watchlist column in the list of students, or if the Add to Watchlist button is marked on the Student Detail. |
Student Display Options
When a staff member wants to keep a closer eye on specific students, they can choose to watch these student scores by marking the checkbox next to their name in the Watchlist column. Once marked, the staff member can simply click the Watchlist icon  under the My Students option to quickly see these student's Early Warning data.
You can add all listed students to your Watchlist by click the Watchlist All button. Selecting the Category Impact button changes the score view to show the High, Medium, or ow value in the list along with a numeric representation of how a focused intervention in a certain category could change the GRAD Score.
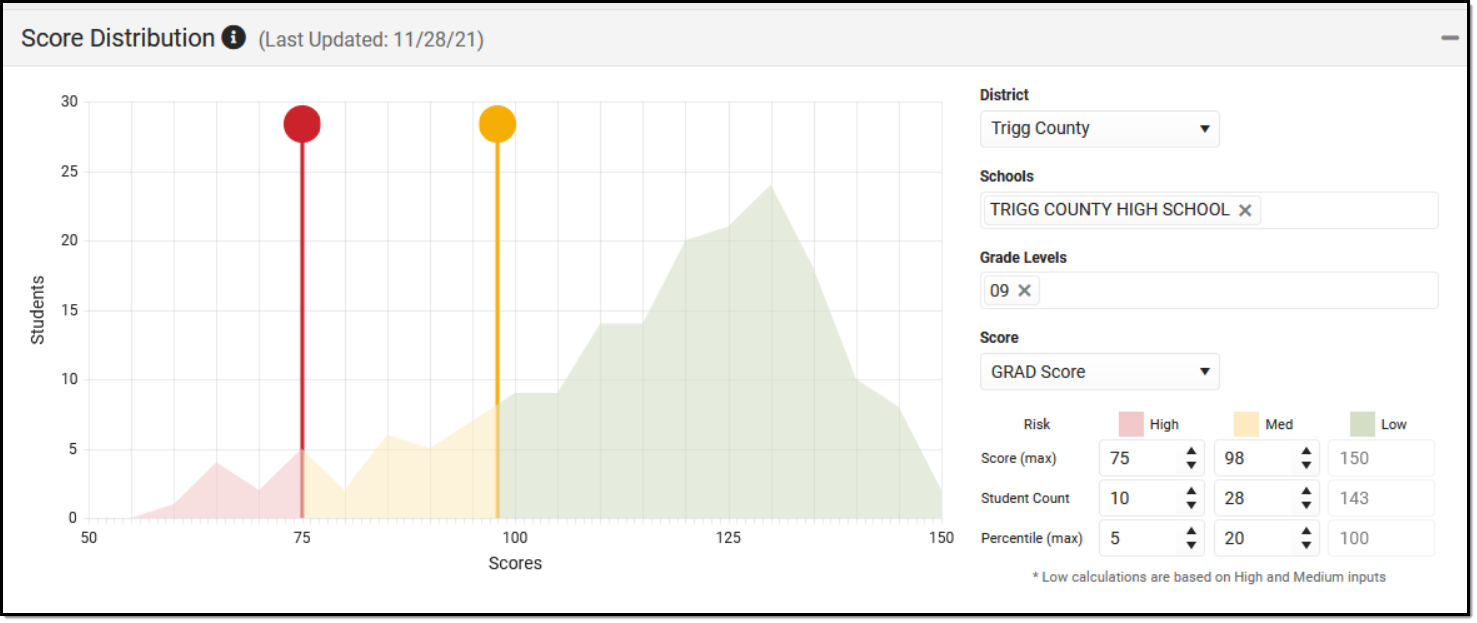
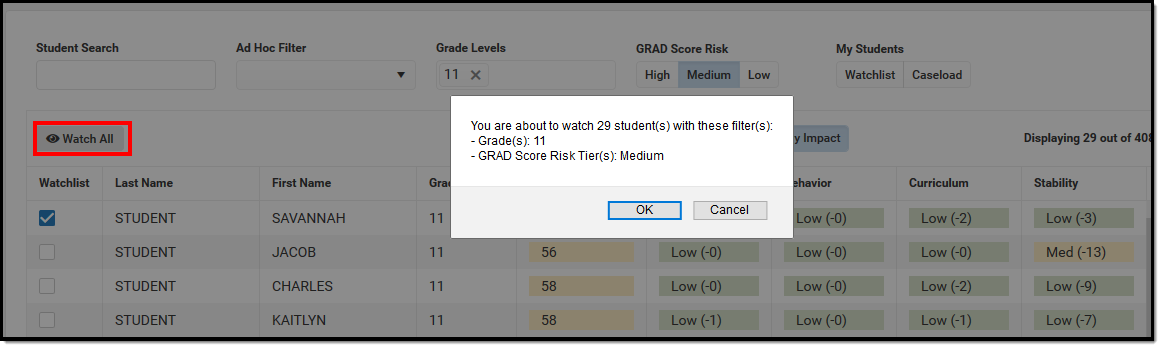
In the image below, 11th grade is selected in the Grade Levels field, along with those 11th grade students who have a Medium level of risk, and the Category Impact option is chosen. 29 students match these options. From here, you can mark the Watch All button to add these students to your Watchlist. Or, further narrow the results.
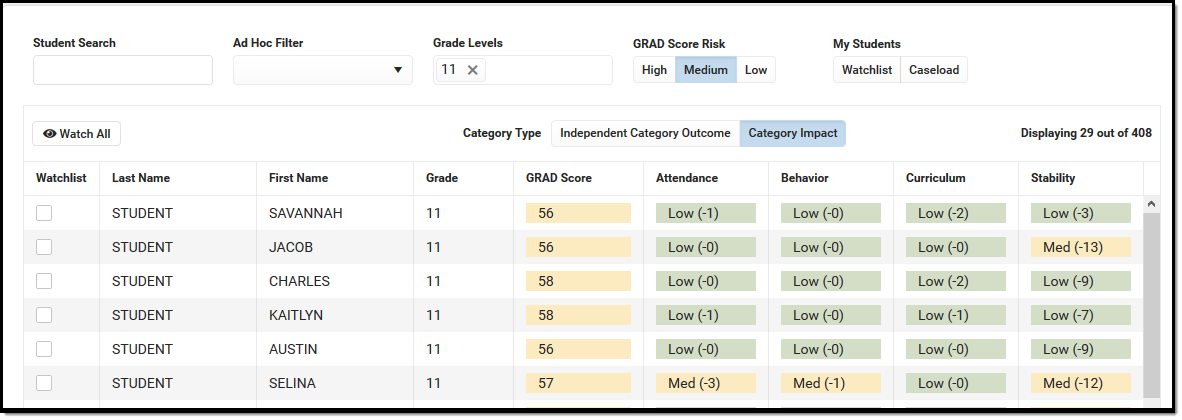 Student Display
When clicking the Watch All button, a validation message displays, verifying this action. Click OK to continue (students are added to your watchlist), or cancel (students are not added to your watchlist).
 Adding Student to a Watchlist
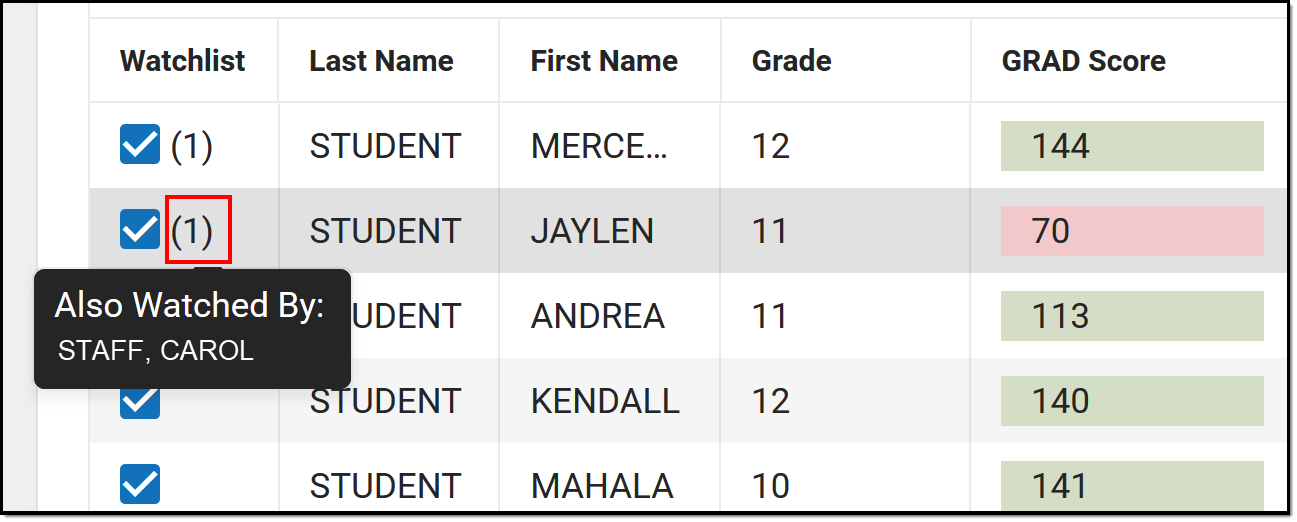
When returning to Early Warning, click the Watchlist button to return just the students you have chosen to watch. If other staff members are watching the same students you are watching, a number will display next to the checkmark indicating the number of staff watching this student and if you hover your cursor over the number, a list of watch staff members will display.
 Other Watched Students
Export to Excel
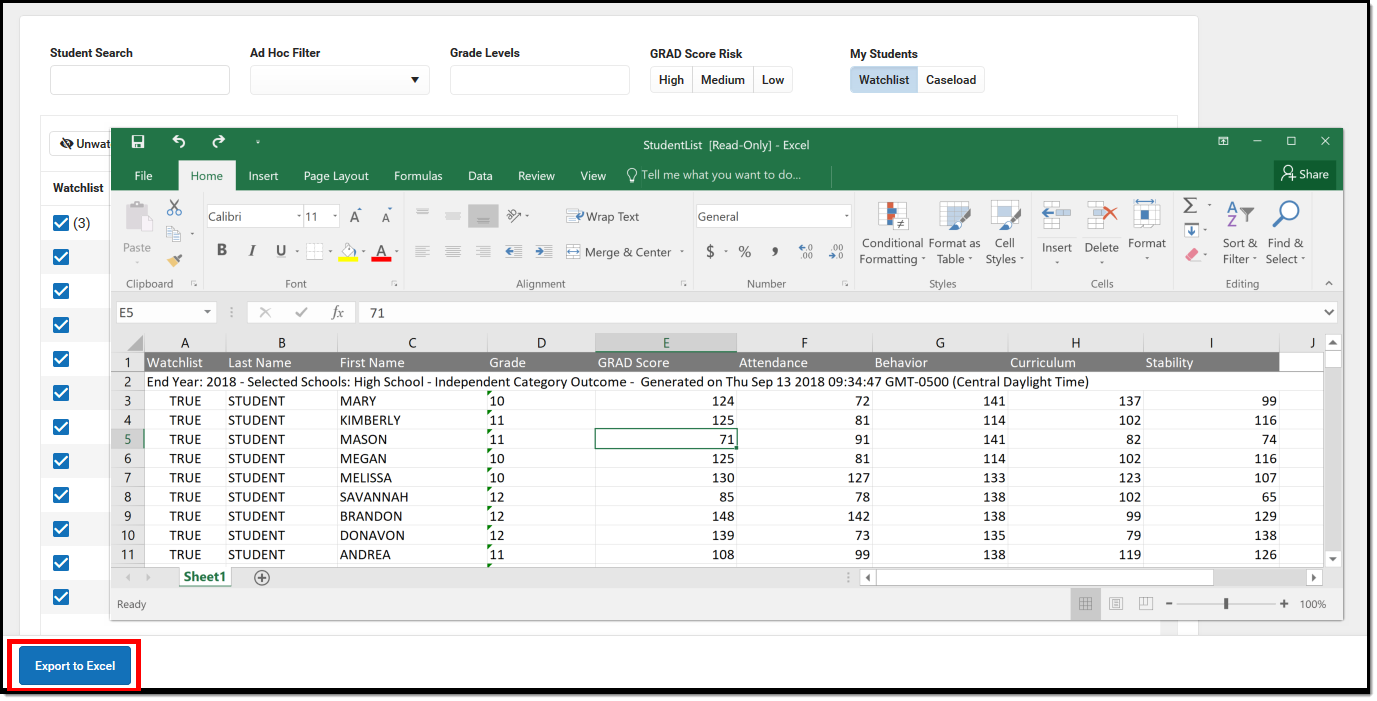
To export Early Warning data into an Excel spreadsheet, click the Export to Excel button. This will export the list of students and data for those students exactly as it is displayed in the Early Warning tool.
- When viewing the list of students with the Independent Category Outcome type selected, the values for each of the categories are listed in the Excel report.
- When viewing the list of students with the Category Impact type selected, the numeric value of the category type is listed. This can be used to determine which program a student could be best served. This is the What If score: if an attendance value is 10, and the behavior value is 29, the GRAD score may be more improved by working with the student on behavior interventions rather than on attendance interventions. The Category Impact values should not be used to compare students.
 Exported Student List