Tool Search: Grades Analysis Report
The Grade Analysis Report groups transcript scores by credit and course and translates these scores into percentiles so users can easily understand the distribution of student performance relative to each credit/course. This report helps visualize aggregated performance by credit, making it easier to identify credits that students struggle to complete.
This report is only available for users in districts who have purchased the Campus Analytics Suite.
 Screenshot of the Grade Analysis Report
Read - View and generate the Grade Analysis Report
Write - N/A
Add - N/A
Delete - N/A
For more information about Tool Rights and how they function, see the Tool Rights article.
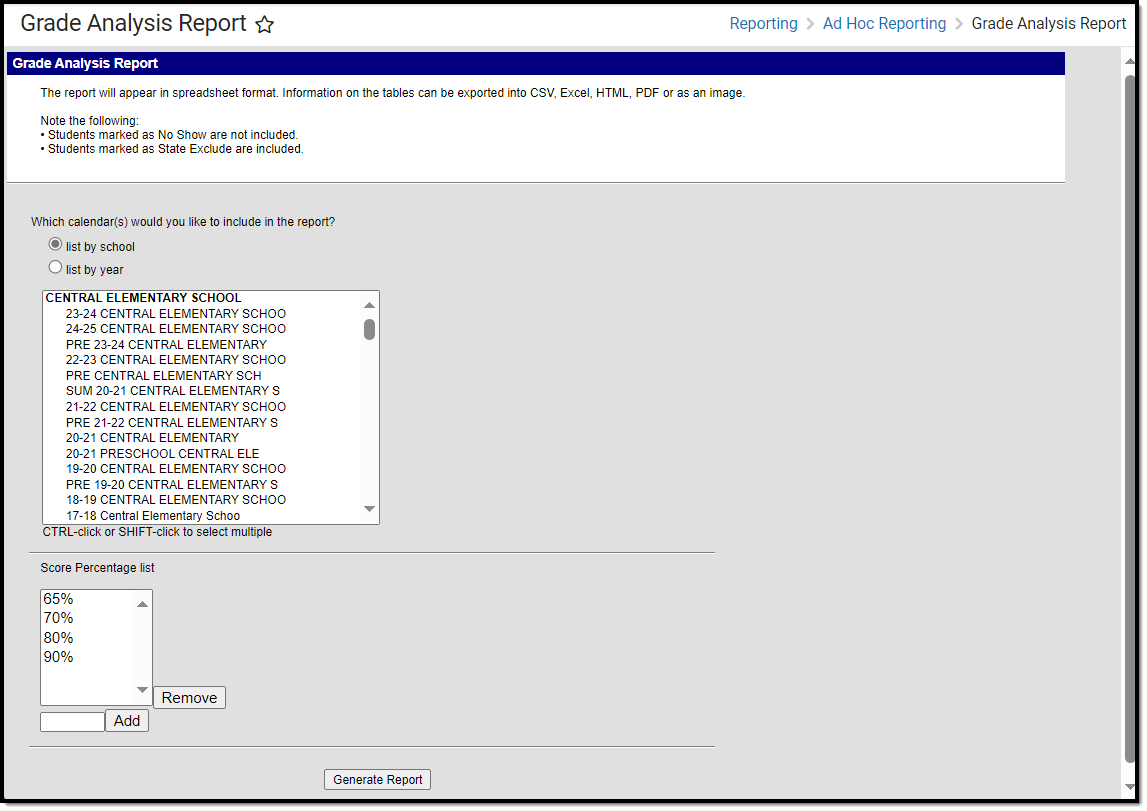
Generate the Report
- Select which calendar(s) to include in the report.
- Select which Score Percentages are included in the report. To remove a percentage, select the percentage from the list and click Remove. To add a percentage, enter it in the text box next to the Add button and click Add. The percentage will appear in the Score Percentage list.
- Click Generate Report. The report will appear in a separate window.
Understand the Report
The information displayed in this report reflects the credit data found on student transcripts, grouped by credit name. This report details a count of students who have the credit on their transcript, a count of total scores for each credit, the average score percent for each credit, and the number of records that do not have a score percent value. Average Percent and GPA data is color-coded to allow for quick identification of high scores (green) or low scores (red/orange).
This report is useful for viewing on average how well students are doing in each course and allows you to double click on each cell to see a breakdown of which students make up the data being reported.
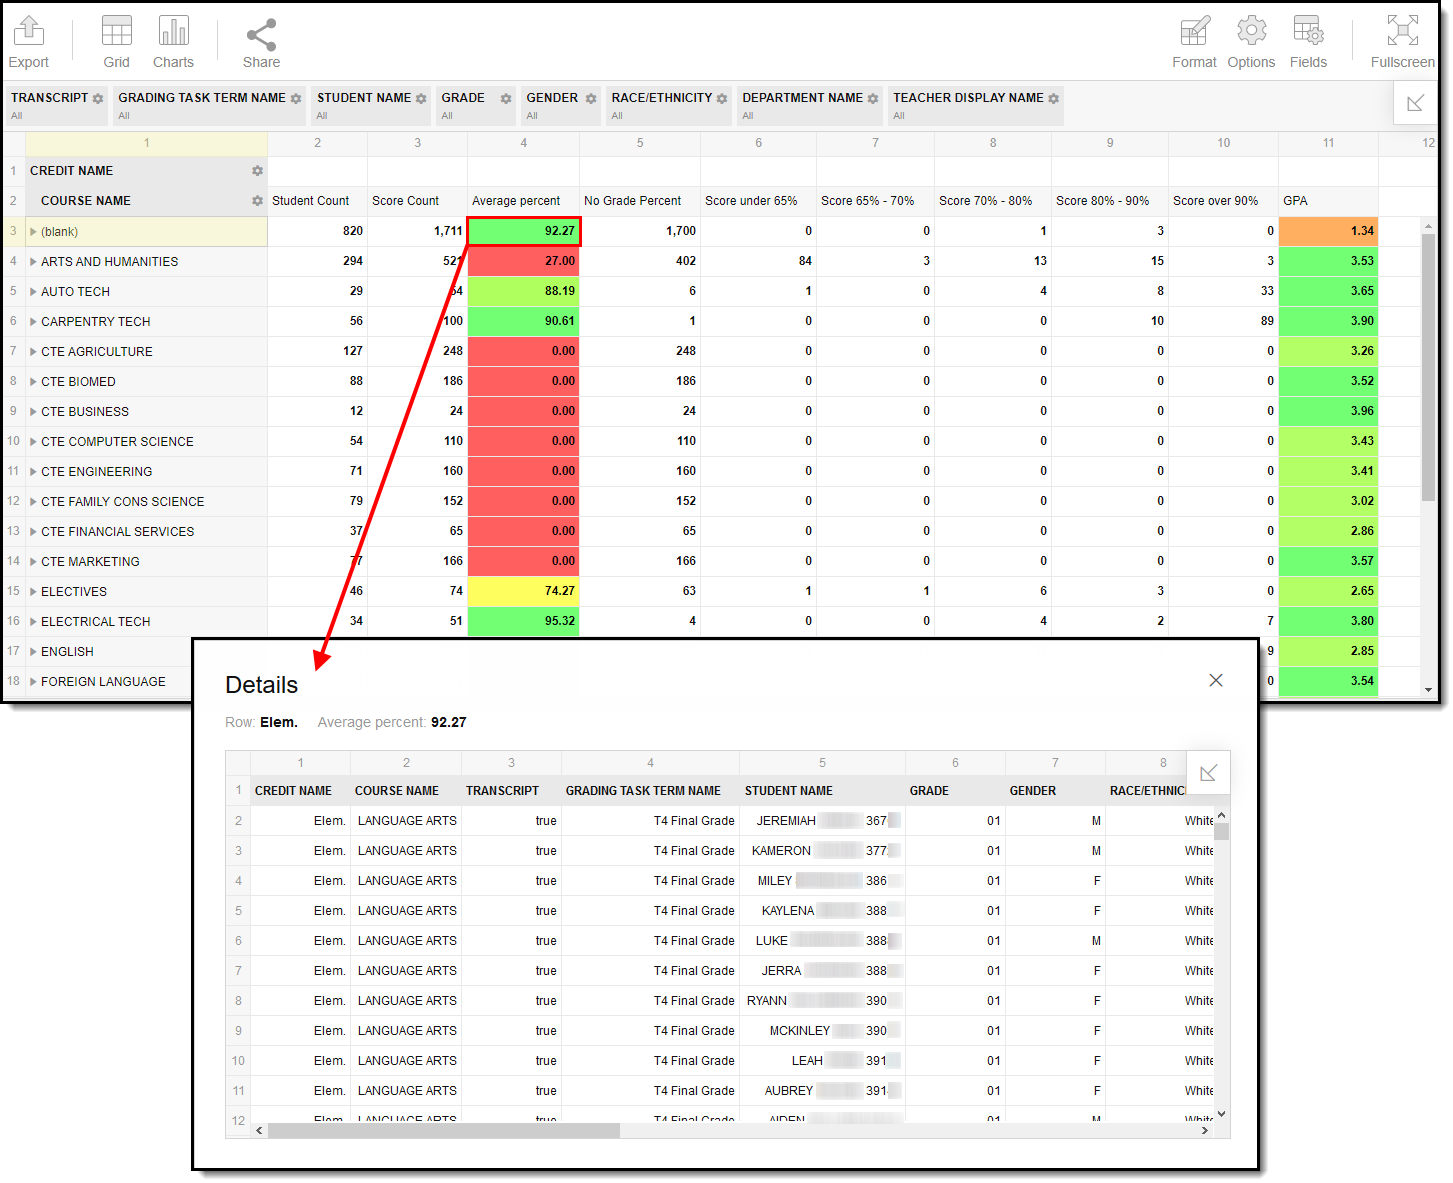
For example, double-clicking the 92.27 Average Percent cell will bring up a list of the students who make up the data reporting in this cell.
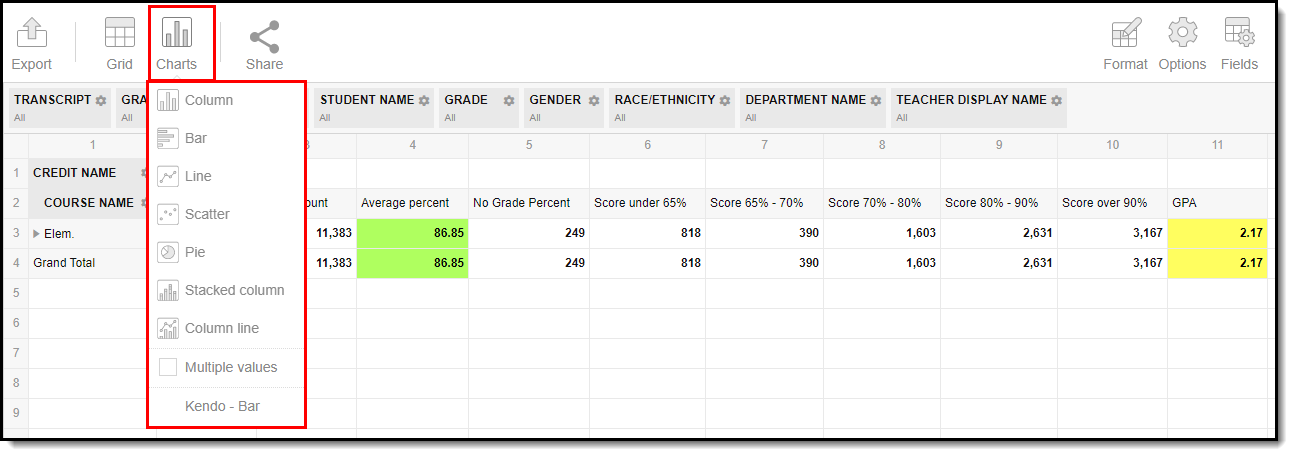
Report data can also be displayed in numerous useful charts/graphs by clicking the Charts button and selecting an option.
Filter Dimensions and Modify Report Options
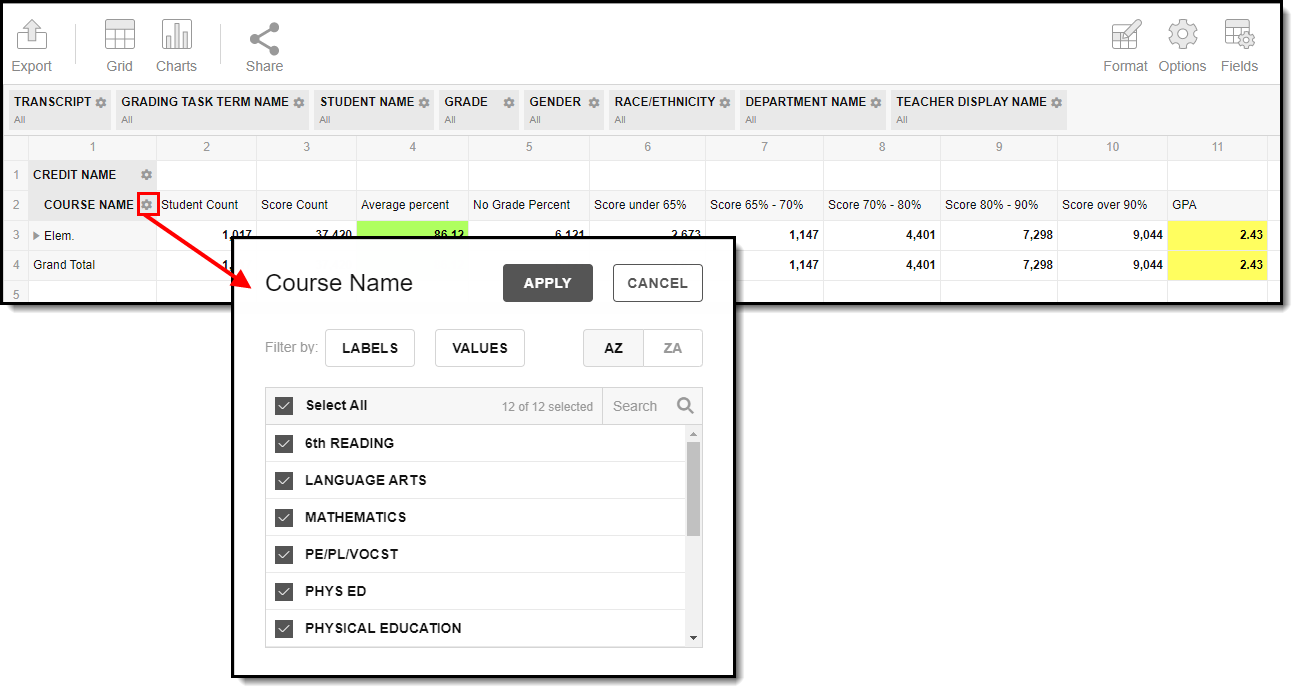
You can filter a report dimension by clicking the gear icon next to the dimension header. From here you can filter dimension data by label or value as well as modify the dimension sort order. For more information about filtering dimensions, see the Pivot Designer article.
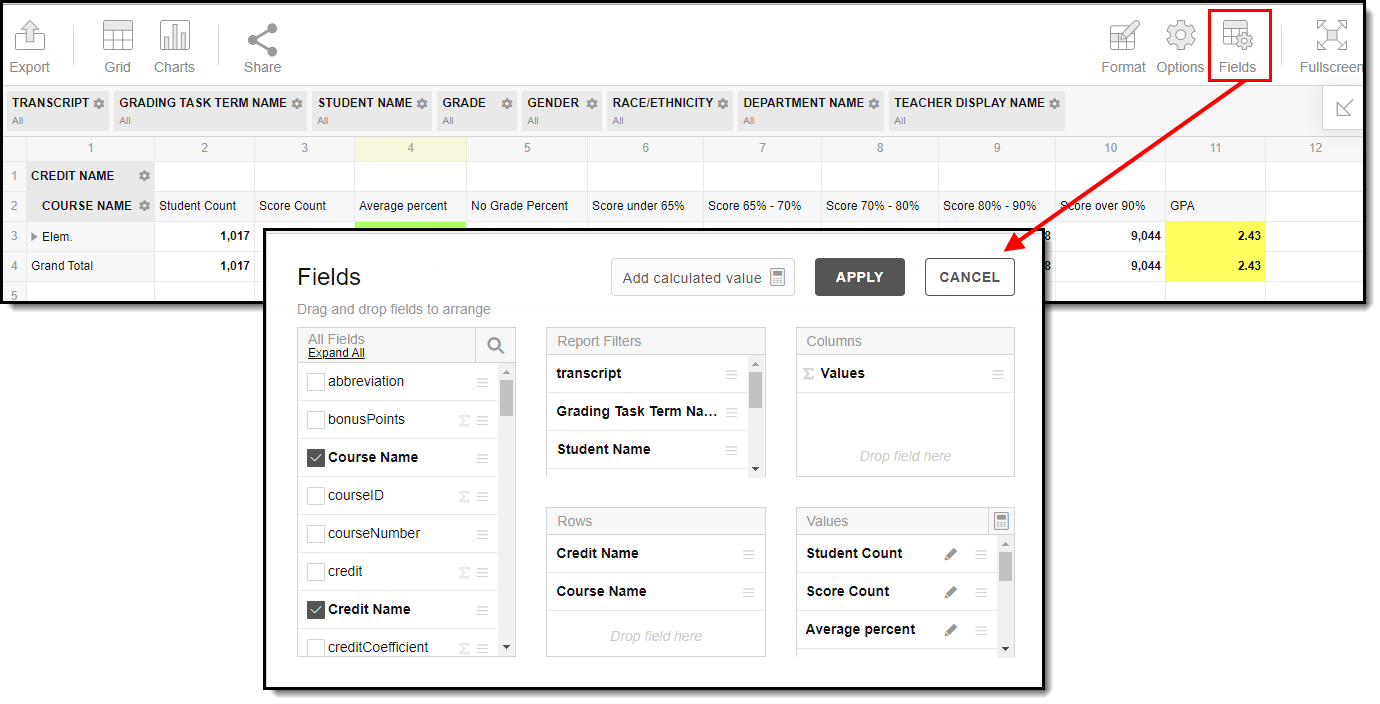
Selecting the Fields icon allows you to modify the order of the fields in the pivot, add or remove fields from the pivot table, and modify which fields are used in rows or columns.
You can also modify or insert specific calculations to be used in the pivot table by clicking the Add calculated value button. When adding calculated values, users can use aggregation key words to produce aggregates that aren't available when selecting the sigma dropdown list.
For more information about modifying fields and adding calculated values, see the Pivot Designer article.
Format and Layout Options
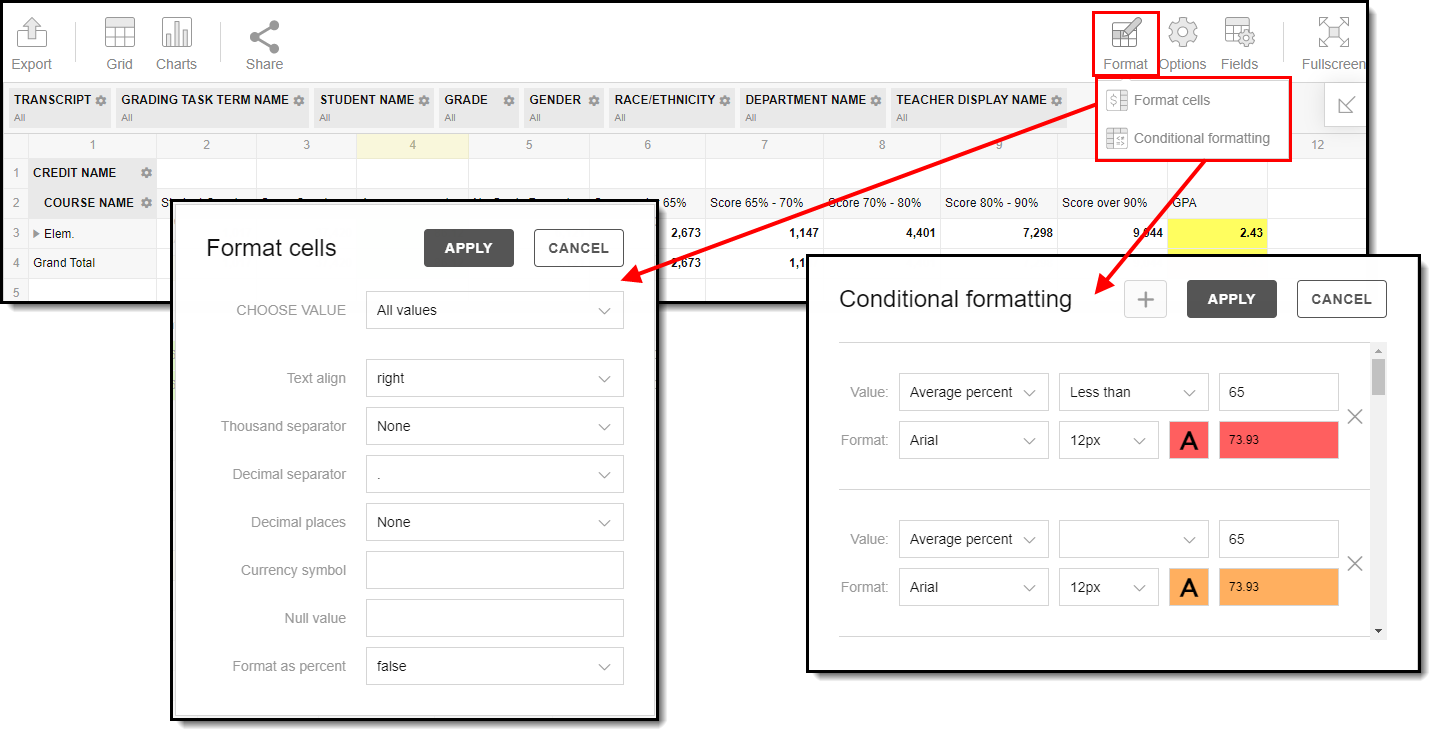
Format options allow you to modify how cells represent data within the pivot table. To access format options, click the Format button and select one of the following options:
- Format cells - This editor allows you to control how text within the cell is aligned, what value is reported in the cells, how decimals are used, the current symbol used, any default null value you want the table to display, and whether or not you want data displayed as a percentage.
- Conditional formatting - This editor allows you to set cell value thresholds as to whether or not the data is reported for each cell (less than or greater than a certain value) as well as modify the cell text size and font.
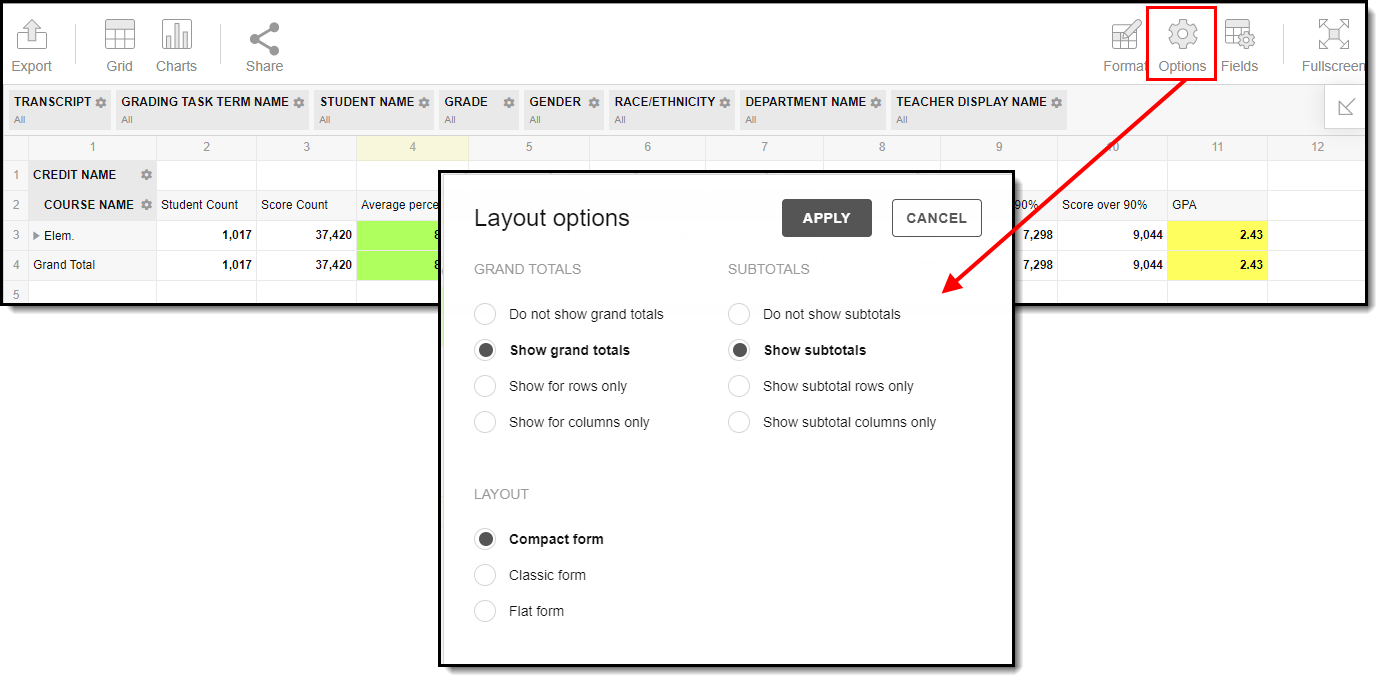
The Options menu gives you layout options for how you would like the table to be displayed (Layout), how grand totals are display in the table (Grand Totals), and how subtotals should be displayed (Subtotals).
For more information about format and layout options, see the Pivot Designer article.
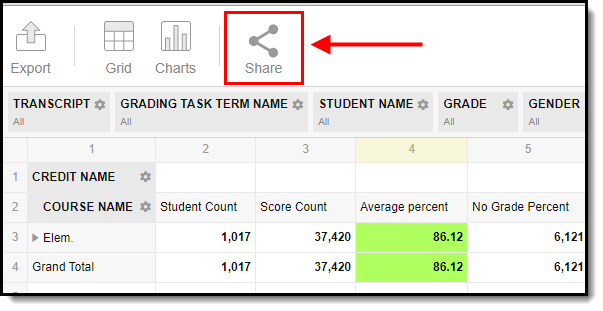
Export and Share the Report
The report (pivot) can be exported to a number of different formats by clicking the Export icon and selecting an option. 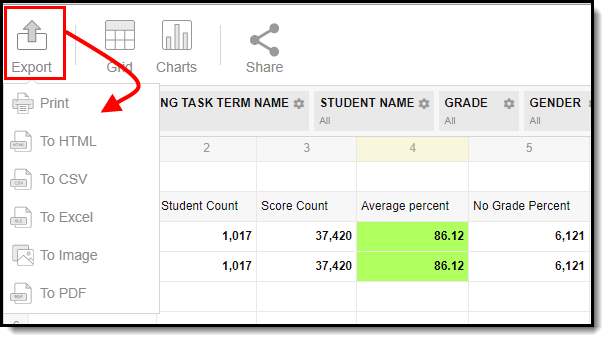 You can also share the report (pivot) with other Infinite Campus users by clicking the Share icon and copying the report URL.
Users attempting to access a pivot table via a shared URL will need to first be logged into Infinite Campus in order to access the tool and have proper calendar rights in order to see reported data.