Tool Search: Assignment Analysis Report
The Assignment Analysis report creates a bar chart representing the students' grades for the selected assignment.
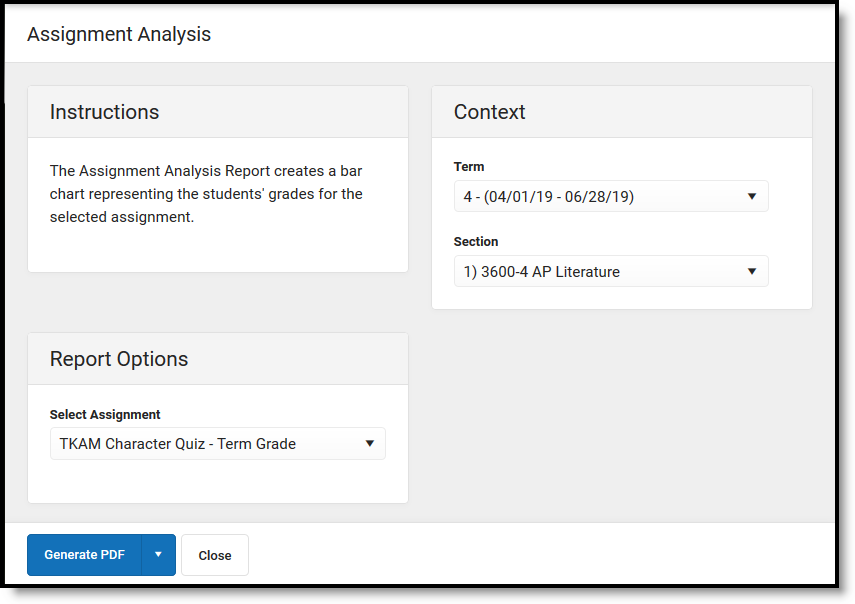 Assignment Analysis Report Editor
Generating the Assignment Analysis Report
- Select the Term and Section of the assignment to analyze.
- Select the Assignment for which you want to view the analysis graph. Only one assignment can be selected at a time.
- Click Generate PDF to view the report in PDF format or click the arrow button next to Generate to select a different format.
The header of the graph reports the selected assignment, as well as its Task/Standard and Category.
The graph show's each student's score received on the assignment, with the percentage of points earned shown next to the student's name.
Below the graph, the Mean and Median scores are calculated, as well as the +/- standard deviation. These values are also represented by blue lines in the graph itself.
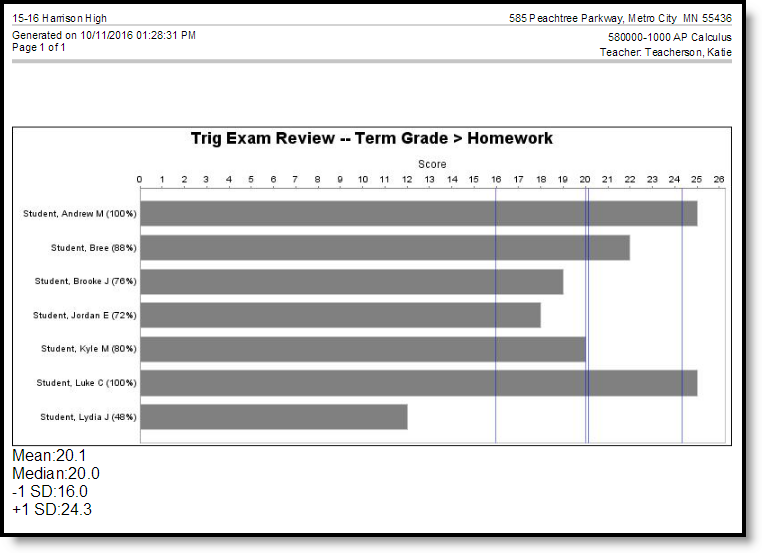 An example of the Assignment Analysis Graph
