Tool Search: Enrollment Summary Report
The Enrollment Summary Report will list a district-wide breakdown of enrollments grouped by school, grade, gender and race. This report will print for one school, multiple schools or All Schools.
 Enrollment Summary Report
Report Logic
The Enrollment Summary Report includes totals of students enrolled in selected schools based on an entered effective date.
Report Editor
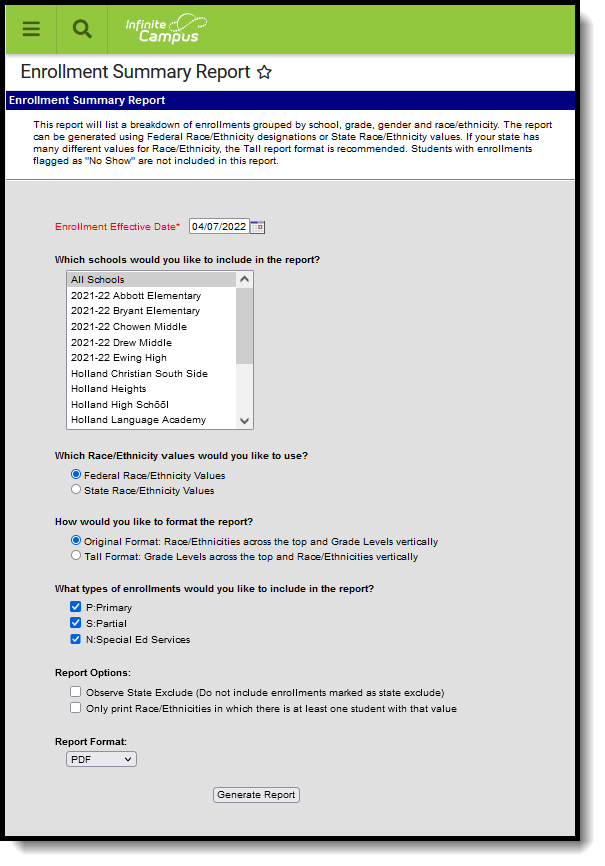
The following information details the Enrollment Summary Report Editor.
| Option | Description |
|---|---|
| Enrollment Effective Date | This required field is used to return actively enrolled students as of the entered date. This field is defaulted to the current date but can be changed by selecting the calendar icon to the right of the field, or entering the date manually in mmddyy format. |
| Which schools would you like to include in the report? | The Enrollment Summary Report can be generated for multiple schools in the district or one school in the district. Because this report is complex, it is recommended to not generate the report for all schools in a district at one time. At least one school needs to be selected. |
| Which Race/Ethnicity Values would you like to use? | Users can select which race/ethnicity values to include in the report - Federal Race/Ethnicity or State Race/Ethnicity Values. Each district is required to collect race/ethnicity data for students, and sometimes staff and parents/guardians based on the following federal values:
States can also require additional values for race/ethnicity reporting, as desired. When choosing the Federal Race/Ethnicity Values on the Enrollment Summary Report, student summaries will be printed using the federal values noted above. When choosing the State Race/Ethnicity Values, student summaries will be printed using the race/ethnicity values defined by the state. |
How would you like to format the report? | The report can be generated using the Original Format or the Tall Format. The Original Format will print race/ethnicities across the top of the report and grade levels vertically.
The Tall Format will print the grade levels across the top of the report and the Race\Ethnicities vertically.
States that have many race/ethnicity values should use the Tall Format. |
| What types of enrollments would you like to include in the report? | Users can select to print only students who have a certain enrollment type chosen on their enrollment record. Enrollment records fall into three categories:
All types can be chosen at one time for display on the report (this is the default selection), but at least one enrollment type must be selected in order for the report to generate. Refer to the Enrollments page for more information on these types. |
| Report Options | The following can be selected when generating the Enrollment Summary Report:
|
| Report Format | Indicates how the report generates - PDF, DOCX or HTML. |
Report Generation
- Enter an Enrollment Effective Date.
- Select the School(s) to include on the report.
- Select the appropriate Race/Ethnicity values to report.
- Select the desired format of the report.
- Select which types of Enrollments to include on the report.
- Select which Report Options to include on the report.
- Select the desired Report Format.
- Click the Generate Report button.
For states that allow the recording of a non-male or non-female gender, a total count of Other is included.
 Enrollment Summary - HTML
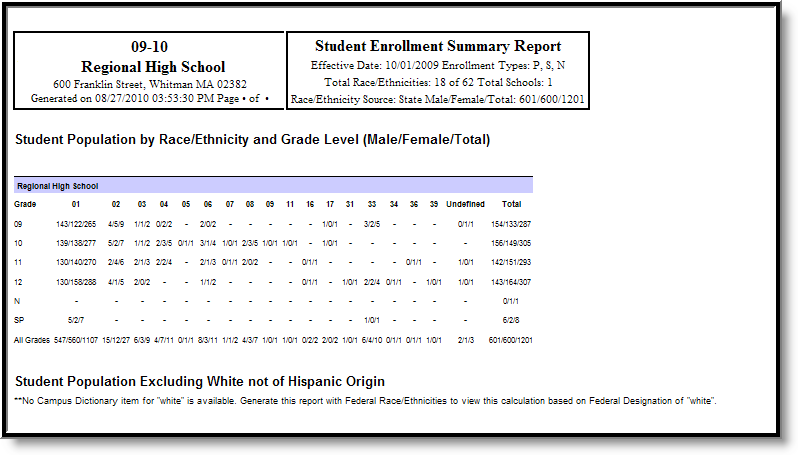
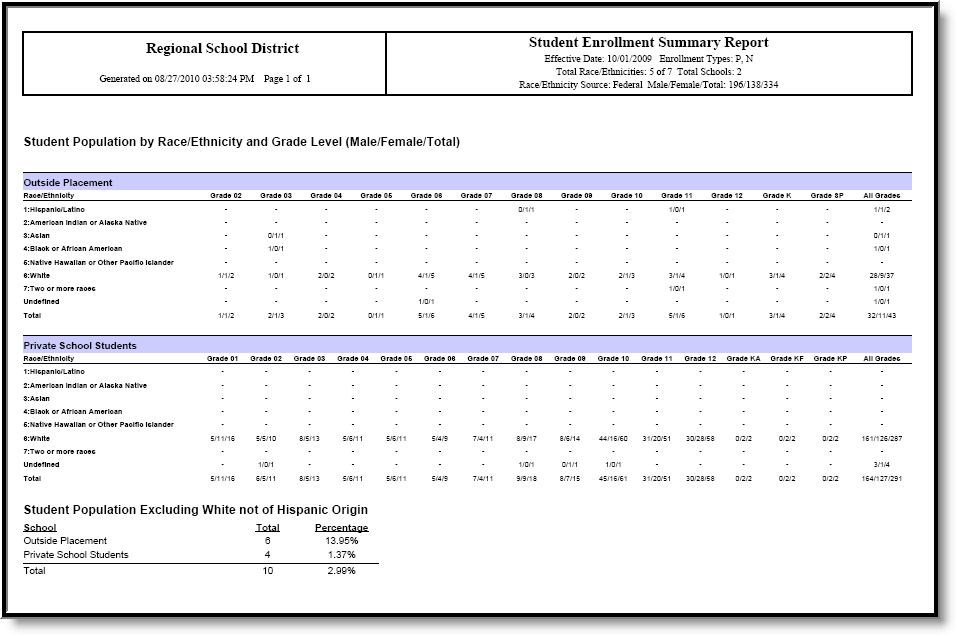 Enrollment Summary - PDF
